When an emergency patient arrives with stroke symptoms, every minute counts. Even if the head CT is done within minutes, a 12-hour reporting delay can derail treatment and outcomes. In radiology, turnaround time (TAT) is more than a workflow metric; it’s a direct measure of system responsiveness.
For hospital leaders, HR teams, and credentialing managers, TAT reflects three things:
- Operational efficiency (how smoothly your systems and teams talk to one another)
- Clinical performance (faster reports can lead to faster diagnosis and treatment)
- Risk and reputation (delays can translate into poor patient outcomes, backlogs, or dissatisfied referring physicians)
In fact, studies confirm that prolonged TAT slows emergency throughput, drives up costs, and extends hospital stays. This makes efficient radiology reporting one of the strongest levers for improving both patient flow and overall system performance.
In this blog, we’ll dive into:
- Typical radiology turnaround time benchmarks across modalities (CT, MRI, X‑ray, etc.) and case types (stat, emergent, routine)
- What drives TAT variability (staffing, tech, workflows, subspecialty reads)
- How TAT history and performance should factor into hiring and credentialing radiologists
- Best practices to set, monitor, and improve TATs
- Red flags: when turnaround times slip into danger zones
- Emerging trends (AI, smarter worklists, load balancing) that are reshaping what “good TAT” looks like
P.S. Struggling with delayed reads or coverage gaps that push your turnaround times higher? AAG Health delivers credentialed, board-certified tele-radiologists who integrate fast, read across all modalities, and keep your diagnostic workflow uninterrupted.
What are Standard Radiology Turnaround Time Benchmarks
Before you can judge whether a radiologist is fast (or slow), you need a clear baseline. The following benchmarks represent common expectations across modalities and urgency levels, though local definitions and workflows can shift results.
What does Turnaround Time (TAT) mean, and how is TAT measured
One major complication here is that there’s no universal definition of radiology turnaround time. Different facilities start and stop the “clock” at different points. The AHRA Best Practices & Benchmarking Task Force outlines several common definitions, including:
- Order → Final Report
- Exam Completion → Final Report
- Exam Completion → Preliminary Report
- Critical Finding → Clinician Notification
Because these starting and stopping points vary, two identical cases can appear to have very different turnaround times. Always confirm how TAT was defined before comparing internal data or candidate performance.
Radiology Turnaround Time (TAT) Benchmarks by Modality and Urgency
Radiology turnaround times differ by modality and urgency level. The following ranges represent typical industry standards used to evaluate reporting performance across imaging types.
- Emergency or STAT CT/MRI (critical cases): Usually expected within 60 to 120 minutes. In one AI-assisted study on intracranial hemorrhage cases, flagged cases were read in ~73 minutes, compared to ~132 minutes for non-flagged ones.
- Routine CT or MRI: Often targeted within a few hours to 24 hours. In places like the UK, national guidance caps report turnaround at a maximum of 4 weeks, though internal goals are often much tighter.
- X-rays (basic radiography): Typically turned around within a few hours or same-day, especially in well-staffed environments with streamlined PACS systems.
- Ultrasound and non-contrast studies: Generally fall in the 6 to 24-hour range, depending on volume and staffing. These aren't quite as fast as X-rays, but don't usually take as long as complex MRIs either.
- Outpatient CT/MRI (non-emergent): Can range from 24 to 72 hours, depending on subspecialty availability and overall demand. Again, many systems aim to stay well below the 4-week max mandated in the UK’s national health system.
Comparing Emergency, STAT, and Routine Radiology Report Times
When you’re vetting radiologists, it’s super useful to compare TATs within the same urgency class. Some points to call out:
- STAT/emergent reads demand the fastest TATs. In many contracts or hospital protocols, STAT readings are expected within 1-2 hours (or even faster, depending on the service).
- Routine reads may have more flexibility, but still need consistency. If your facility promises “next‑day read,” but your radiologist’s historical TAT is often 48-72 hours, which is a red flag.
If someone reports a mean TAT across both stat and routine cases without a breakdown, you can’t infer how responsive they’ll be under pressure.
Common Reasons Radiology Turnaround Times Fall Outside Benchmarks
When TATs consistently exceed benchmarks, deeper workflow or staffing problems are often to blame. Key factors include:
- Bottlenecks in handoff (imaging to PACS to radiologist queue)
- High volumes or overtime spikes
- Subspecialty reads (some cases require second reads or extra review)
- Technical, administrative, or RIS/PACS issues
- Night/off-hours reads (fewer staff, slower turnarounds)
As we have mentioned above, extended imaging turnaround times are strongly linked to longer hospital stays and higher costs. For instance, one hospital benchmark identified a target emergency-department-to-imaging TAT of 77 minutes; exceeding this threshold prompted process redesigns to restore efficiency.
Key Factors That Affect Radiology Turnaround Time (TAT)
Even with clear benchmarks in mind, the “real-world TAT” can swing wildly depending on several factors. When you’re hiring or credentialing, knowing what drives those swings is gold; it lets you distinguish between the delays that are “red flags” and those that are just context.
Here are the big drivers (and complicators) to watch:
1. How TAT Is Defined (Measurement Start/Stop)
First, the most basic variable: how TAT is defined. If one facility measures from “order entry → final report” and another from “exam complete → final report,” their numbers won’t be comparable. Choosing different start/end points can shift apparent TATs by hours or more.
When you compare a candidate’s historical TATs, you need to ask: What was their definition? Otherwise, you might penalize someone for differences in measurement, not performance.
2. Study Volume, Case Mix, and Timing
High volume or bursts in demand can push TATs upward, even in efficient systems. Some nuances:
- Peak load hours/off‑hours/nights/weekends: Fewer staff, more handoffs, tech lag
- Complexity & subspecialty mix: A complex neuro MRI or advanced vascular CT may take much longer than a chest X‑ray
- Backlog stacking: If some cases are already delayed, newer ones can stack up behind them, creating a cascade
- Distribution of case types: If a radiologist has more emergent/STAT reads, they may show “worse” average TATs compared to someone mostly reading routine cases
In fact, in the “Effect of Radiology Study Flow on Report Turnaround Time” paper (AJR), the authors found that factors like time into shift, resident involvement, and RVU (relative value unit) flow impacted individual radiologist TATs.
3. Staffing Levels, Skills, and Subspecialty Coverage
The human element remains huge:
- Experience & speed of individual radiologists: A senior, well-practiced reader tends to move faster (with quality) than someone still getting up to speed
- Subspecialty vs generalist balance: Some cases may require subspecialist reads, second opinions, or extra checks
- Radiologist availability & shift coverage: If your coverage at night or weekend is skeleton, TATs will suffer during those windows
- Burnout, fatigue, interruptions: As workloads push, cognitive load and interruptions reduce throughput and increase error risk (“the ugly side of TAT”)
4. Technology, PACS/RIS, and Workflow Reliability
A few more wildcards that can mess with TATs:
- Emergent/unplanned surges: Unexpected trauma, strokes, mass casualty events, or infectious disease spikes
- Technical or network failures/downtime: If your systems (PACS, RIS, network) go down, everything stalls
- Regulatory or documentation burdens: Extra checks, peer reviews, or compliance steps may be necessary in some environments
- Teleradiology/cross-site distribution: If reads are outsourced or done remotely, delays in image transfer or prioritization across sites can add to lag

Radiology Credentialing: Evaluating Turnaround Time (TAT) Performance
Turnaround time (TAT) is a key indicator of a radiologist’s efficiency and reliability. Consistently fast, accurate reporting shows strong workflow alignment, while chronic delays often point to process or time-management issues.
Why TAT Matters in Radiologist Hiring
TAT directly affects patient care, emergency throughput, and your reputation with referring physicians. Radiologists who deliver timely reads keep care teams moving; slow or inconsistent reporting can stall treatment and inflate hospital stays.
How to Assess TAT Data During Credentialing
When reviewing a radiologist’s turnaround time record, don’t stop at the average number. Dig deeper into how their data was captured and what it represents.
- Request detailed TAT reports by urgency and modality (CT, MRI, ultrasound, X-ray). This breakdown shows how the candidate performs under different workloads, not just routine cases. A strong performer maintains speed even with high-acuity studies.
- Confirm how TAT was measured, from order entry or exam completion, to make comparisons fair. Two institutions using different start and end points can report drastically different results for the same efficiency level.
- Review case volume, urgency mix, and shift coverage. A radiologist handling 100 mixed cases across overnight shifts faces very different demands than one reading 40 routine day cases. Context turns the numbers into meaningful insight.
- Evaluate medians and percentiles, not just averages. Outliers can distort mean values. Median and 90th percentile data reveal whether the radiologist is consistent or if performance drops sharply during peak hours or complex reads.

Integrating TAT Standards into Credentialing
Embedding turnaround time (TAT) expectations into your credentialing process ensures every radiologist understands performance standards from day one. It also keeps your quality and compliance programs measurable, transparent, and fair.
- Define contractual benchmarks, for example, 90% of STAT reads within two hours. Clear targets set accountability and remove ambiguity during performance reviews or contract renewals.
- Use performance dashboards to track compliance. Real-time analytics highlight trends, flag outliers, and help department leads intervene early before delays escalate. Visual tracking also motivates consistent improvement.
- Pair TAT metrics with accuracy, peer review, and clinician feedback for a complete performance view. Speed should never come at the expense of quality, so balanced metrics protect both patient outcomes and diagnostic reliability.
- Review benchmarks annually. Imaging volumes, technology, and workflows evolve quickly; updating expectations keeps credentialing standards relevant and achievable.
Best Practices to Improve Radiology Turnaround Time (TAT)
Improving turnaround time is all about designing smarter systems, supporting the right tools and culture, and continuously monitoring what’s working. Here are some proven strategies (and caution zones) to help your radiology operation get leaner and more responsive.
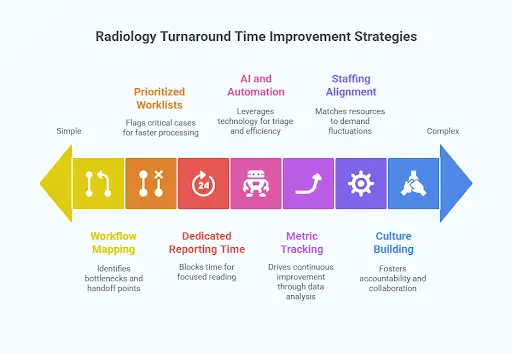
1. Start by mapping the workflow end-to-end
Before you tweak anything, map out every step of the radiology journey: order entry, scheduling, image acquisition, tech QC, image transfer to PACS, queuing, reading, report sign-off, and clinician notification.
Identify handoffs and hold points. Process mapping often exposes bottlenecks you didn’t even know existed, like long delays transferring images into the queue, or “orphan” studies that fall through the cracks.
2. Prioritize cases with Smart Worklists
Some reads are more urgent, so your system should reflect that. Many high-performing radiology services use prioritized worklists instead of simple FIFO queues.
For example, in a simulation using AI to flag chest X‑rays, critical cases (e.g., pneumothorax) were processed faster (35.6 min vs 80.1 min) using priority logic, compared to standard FIFO.
This means urgent/STAT cases can “jump the queue” or be escalated automatically, which lowers their TAT without necessarily hurting routine reads (if balanced well).
3. Protect Dedicated Reporting Time
If your radiologists are fragmented by meetings, administrative tasks, or interruptions, their reading time will suffer. Many best-practice departments block off dedicated “reporting time” slots where radiologists focus solely on reads and aren’t pulled into extraneous demands.
This is especially helpful for moderating the unpredictable surges in demand or interruptions.
4. Leverage AI, Automation, and Real-Time Dashboards
Tech tools can be powerful here when used appropriately:
- AI/algorithmic triage: Prioritize critical findings, flag anomalies, or triage cases so radiologists see the most urgent ones first. (As we saw above, AI‑based worklist prioritization in chest X‑rays cut average TAT for urgent findings)
- Smart queues/load balancing: Share reads across sites or radiologists to even out peaks and maintain throughput
- RIS/PACS optimization: Fast image transfer, integrated viewers, minimal latency, seamless handoffs… the smoother the digital path, the less “waiting on tech” time eats up
- Automated notifications & alerts: If a study is about to breach target TAT, notify a manager or trigger escalation
- Advanced workflow dashboards: Real-time dashboards let you see live queue backups, bottlenecks, overdue reads, and where you need to shift resources
5. Track Metrics and Drive Continuous Improvement
You’ll need a culture of continuous improvement. Metrics without action are useless. Here’s how to make that operational:
- Define core KPIs like reporting TATs per modality/urgency, % exceeded, 90th percentile, and backlog size
- Review these KPIs regularly (daily, weekly) with the team. Use heat maps or trend charts to spot red flags early
- Hold root-cause reviews for outliers. When a report takes much longer than expected, investigate: Was it a tech issue? A staffing gap? An ambiguous study needing extra consult?
- Run small rapid-cycle experiments (“Plan-Do-Study-Act”) to try tweaks like shifting staff schedules or reassigning case types. Measure before/after.
- Benchmark internally (across sites or shifts) and externally (peer hospitals or published reports) so you don’t stay blind to what “good” looks like in similar settings. For instance, the Imaging Performance Partnership’s reports offer reference points for technologist productivity and imaging TATs.
6. Align Staffing and Resources with Demand
Even the best workflow won’t help if you're chronically understaffed or poorly scheduled. Some tactics:
- Match staff schedules (radiologists, technologists, support) to predicted volume curves (e.g., more coverage in peak hours)
- Use float or backup readers during surges
- Consider cross-site or teleradiology support during off-peak or backup hours
- Upskill or delegate parts of the workflow. For example, give advanced technologists or radiographers the tools to take on basic reads or QA tasks where regulations allow (some hospitals in the UK are expanding radiographer reporting).
- Use predictive modeling (based on historical volume trends) to preempt surges and staff accordingly
This is one area where AAG Health can make a huge impact. We support clients with on-demand, subspecialty-aligned readers, so when volume spikes or coverage gaps hit, your TAT doesn’t suffer.
7. Build a Culture of Accountability and Collaboration
Technology and processes matter, but people carry the system. Some principles:
- Make TAT performance visible (dashboards, scorecards) so individuals and teams can see how they’re doing
- Encourage ownership: Let radiologists, technologists, and support staff propose workflow improvements. This is effective because the people doing the work often have the best ideas.
- Recognize and celebrate successes (e.g., “this week we reduced backlog by 30%”)
- Use peer review, feedback loops, and coaching to help those who struggle hit benchmarks, but be sure to do so supportively rather than punitively
Red Flags and Warning Signs of Radiology Turnaround Time (TAT) Problems
Turnaround times don’t usually collapse overnight. They decline gradually. And if you’re not watching closely, that slow creep can start to impact patient care, clinician trust, and your hospital’s reputation before anyone sounds the alarm.
Early Warning Signs of TAT Delays
One of the first signs that things are off is a pattern of missed benchmarks, not just once, but consistently. Maybe the average TAT is rising month over month. Maybe a few cases are taking days instead of hours. Or your median TAT looks fine, but the long tail of outliers is growing. Those extremes are where risk hides.
Another early warning is clinician feedback. If referring doctors or care teams start complaining about delays, even when the data looks “within range,” listen. Perception often reflects pain points the metrics can’t see yet.
When Promises Don’t Match Performance
A major red flag is when the numbers don’t match the pitch. A radiology group promising two-hour STAT reads should have historical data to prove it. Avoid candidates or vendors who can’t break down results by urgency or modality or who can’t explain how their TAT is measured.
Strong performers maintain consistency even under heavy volume—not just during slow periods.
Operational Impact of Prolonged Radiology TAT
When turnaround time slips, everything else slows down. Diagnoses are delayed. Treatment plans are put on hold. Discharges take longer. Emergency departments get backed up, and frustration builds. And in some cases, critical findings are missed or acted on too late, which can lead to legal exposure or patient harm.
A 2024 study laid this out clearly: longer TATs directly impact clinical outcomes, increase operational stress, and erode trust between departments.
How to Respond When Radiology TAT Slips
When you see signs that turnaround times are slipping, try to resist the urge to jump straight to blame. Instead, treat it like a system problem first.
Start by reviewing cases that breached targets, and follow them from start to finish. Where exactly did the delay occur? Was it a PACS issue? A staffing problem? A breakdown in how cases were routed?
Loop in your team of radiologists, techs, admins, and IT staff and get a full picture of what’s going wrong. Then look for quick wins. Can you rebalance staffing? Adjust prioritization logic? Tighten up communication?
It also helps to set up real-time alerts or dashboards that flag cases approaching their TAT limits. That gives you a chance to act before a minor delay becomes a major one. And when you talk to staff, frame it around support and improvement rather than blame.
The bottom line
TAT issues are usually symptoms, instead of root problems. But if you ignore them, they can become full-blown risks. The earlier you catch them, and the more collaborative your response, the better chance you have of keeping your system fast, safe, and trusted.

The future of radiology TAT benchmarks
As imaging demands grow and healthcare evolves, what “good” turnaround times look like will shift. Radiology won’t stay static, and neither will benchmarks.
Let’s take a look at some of the major trends shaping how TAT will be viewed, measured, and optimized in the coming years.
1. AI-Driven Radiology Workflows and Smarter Triage
One of the biggest influences will be AI‑assisted workflows. Already, studies are showing real impacts:
- In chest CT angiography (CTPA) for pulmonary embolism, introducing AI‑triage software reduced TAT from ~68.9 minutes to ~46.7 minutes during working hours, a drop of ~22.2 minutes
- In general radiography, using generative AI to pre-draft report text saw radiologist reading times fall by ~25% (from ~25.8 sec to ~19.3 sec) in a controlled study
- A pilot simulation compared standard vs AI-assisted workflows, and the average reporting time dropped from 573 seconds to 435 seconds using AI‑drafted reports, without compromising clinically significant error rates
These results indicate that AI tools—such as automated prioritization, anomaly detection, and real-time flagging, will redefine acceptable TAT levels. Future benchmarks may be separated into AI-assisted and human-only categories, with the latter gradually phasing out.
2. Granular, Data-Responsive TAT Benchmarks
Benchmarks will get more nuanced. Instead of a single “X hours for CT,” we’ll see:
- Dynamic benchmarks tied to real-time factors like time of day, staff load, and imaging volume
- Percentile-based goals (e.g., 90th percentile TAT) instead of just mean or median
- Case complexity factoring: benchmarks adjusted for how difficult the scan is (e.g., neurovascular or interventional)
- Stratification by modality, urgency, and pathway (outpatient, inpatient, emergent)
- Alerts and thresholds embedded in software, so a TAT benchmark is actionable (e.g., alerts when a read is about to breach the “acceptable” window)
In other words, benchmarks will shift from being static target numbers to living, contextual guardrails that adapt to conditions.
3. Integrated Radiology and Clinical Systems
Turnaround time optimization will depend on how seamlessly radiology connects with hospital systems. Expect:
- Unified workflows across scheduling, acquisition, reporting, and result communication
- AI and informatics tools synced with EHR, lab, and clinical priorities
- Automated “clock start” once imaging acquisition is complete, ensuring consistent timing
Emerging modular reporting models, where AI drafts sections and radiologists finalize them collaboratively, will further shorten TAT and standardize quality across networks.
Build a Faster, Smarter Radiology Team with AAG Health
At the end of the day, radiology turnaround time (TAT) is a performance metric, but it’s also a signal. It tells you how well your imaging pipeline is tuned, how responsive your radiologists are under pressure, and how aligned your workflows, technology, and people really are.
In radiology, every delay ripples outward through care teams, scheduling, and ultimately, patient outcomes. At AAG Health, we understand that radiology turnaround time is a direct line to clinical performance, operational flow, and reputation.
We help you find the professionals who show up fast, read accurately, and integrate seamlessly into your system.
Let’s turn TAT into your strength instead of a stress point.
Contact us to build a radiology roster that keeps your benchmarks tight and your clinicians confident.
FAQs
How do radiology information systems improve turnaround time?
Radiology Information Systems (RIS) streamline workflows by tracking imaging studies, automating radiology reporting, and integrating with PACS and scheduling tools. A well-optimized RIS is key to reducing delays across any busy imaging facility.
What is considered an acceptable turnaround time for CT scans?
For most radiology departments, an acceptable turnaround time (TAT) for CT scans depends on urgency. Emergency or stat CT scans are typically expected to be read within 1-2 hours. Routine outpatient CT scans may fall in the 24-48 hour range, depending on volume and resources. Timely interpretation is crucial for clinical decision-making, especially in high-acuity settings.
How do facility characteristics or facility type impact radiology TAT?
Turnaround times can vary widely based on facility characteristics such as staffing levels, imaging volume, subspecialty access, and available technology. For example, imaging centers that focus on outpatient diagnostic imaging may have shorter wait times for basic radiography, while large hospitals might prioritize emergency CT or MRI reads. Facility type (academic, community hospital, standalone center, etc.) also influences workflow complexity and available support systems.
How does artificial intelligence influence radiology turnaround times?
Artificial intelligence tools can prioritize cases in the queue, flag critical findings like hemorrhages or pneumothorax, and even pre-draft sections of reports. In many cases, this tech helps radiologists cut turnaround times significantly, especially for high-risk or routine cases.
How should radiology departments measure and track TAT?
Effective tracking starts with a consistent definition. Most radiology departments measure TAT from image acquisition to final report sign-off, though some include the time from order entry. Tools like PACS, RIS, and integrated dashboards help automate tracking and highlight bottlenecks. Granular data by modality (e.g., CT, MRI, ultrasound) and case priority helps departments set realistic internal targets and track trends over time.
Is there a national benchmark for diagnostic imaging TAT?
There’s no one-size-fits-all national standard, but various organizations, including the American College of Radiology, have published guidelines and survey data that serve as informal benchmarks. Many hospitals aim for stat cases to be read in under 2 hours and routine diagnostic imaging within 24-48 hours. Internationally, systems like the UK’s NHS set maximum limits (e.g., 100% of studies reported within 4 weeks), though internal targets are usually tighter.
How does radiography wait time differ from TAT?
Radiography wait time usually refers to how long a patient waits between ordering and completing a scan, while TAT refers to the time from image completion to final report. Both are important since long wait times can delay care, and slow TATs can stall diagnosis. Optimizing both requires well-coordinated workflow systems, appropriate staffing, and smart use of tech like AI or auto-routing tools.
How does diagnostic radiology differ in TAT compared to interventional or subspecialty areas?
Diagnostic radiology generally has faster turnaround times, especially for common modalities like X-ray, CT, and ultrasound. Subspecialty areas like interventional or neuro often require more detailed reads and consultation, which can slow things down. Having access to subspecialists or using teleradiology to offload complex cases can help maintain target TATs even when cases become more complex.
