
Nursing and caring professionals hold up much of the U.S. healthcare workforce, yet every year brings deeper gaps in staffing, retention, and training pipelines. As patient demand grows and the workforce ages, your teams face harder choices, such as who to hire, how to keep them, and where to focus limited resources.
Delays in hiring or training now can lead to long-term pressure on budgets, care quality, and patient access.
In this article, we'll give you 62 data points that help you assess risk, compare staffing levels, track workforce shifts, and prepare for what’s ahead. But first, let's start with a look at the key healthcare personnel statistics shaping the field.
Key Healthcare Personnel Statistics
These are the headline numbers shaping the nursing and caregiving workforce in 2025. Each one gives you a clear starting point to assess scale, pressure, and change across the care system.
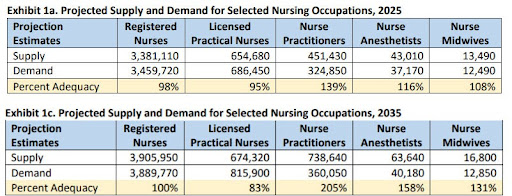
- According to the NCSBN, there are almost 5.9 million active RN licenses across all U.S. states in 2025.
- The U.S. Bureau of Labor Statistics (BLS) projects that there will be over 194,500 job openings for registered nurses annually through 2032.
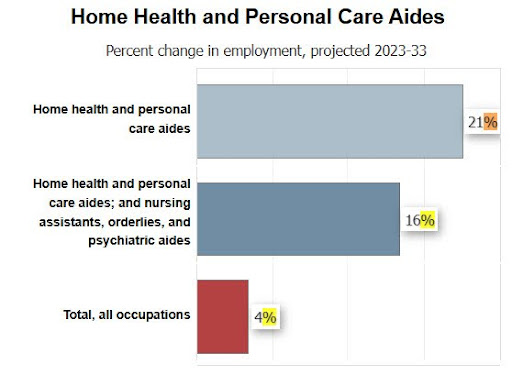
- Employment for home health and personal care aides is expected to grow 21% from 2023 to 2033, with an average of about 718,900 job openings each year.
- Employment for nursing assistants and orderlies is expected to grow 4% from 2023 to 2033, with an average of 216,200 openings each year.
- The U.S. BLS projects that employment for APRNs will grow by 40% from 2023 to 2033.
- The American Association of Nurse Practitioners (AANP) confirms that NPs continue to provide nearly 1 billion patient visits each year.
- HRSA projects a 10% RN deficit by 2027.
Healthcare Personnel Workforce Size & Growth
Meeting demand across the healthcare system depends on understanding where the workforce stands today and how fast it’s growing. These are the core employment projections shaping your next 5-10 years of planning. They include job outlooks across nursing, care aide, and administrative roles, based on current U.S. labor data.
8. According to the U.S. Bureau of Labor Statistics, employment of registered nurses is projected to grow by 6% from 2023 to 2033.
For workforce planners, this growth adds pressure to fill vacancies while retirements rise. Even steady growth means tens of thousands of new hires are needed each year just to keep pace. Without targeted recruitment and support programs, facilities risk falling behind on both coverage and care quality.
9. Roughly 4 million registered nurses (RNs) are expected to retire by 2030.
This wave of exits will leave critical experience gaps across hospitals, clinics, and long-term care settings. As senior nurses leave the workforce, the need to develop leadership pipelines and mentorship programs becomes urgent. You may also see higher onboarding costs and longer ramp-up times for newer hires.
10. LPN and LVN employment is projected to reach 674,700 by 2033, with about 54,000 job openings each year.
Filling these positions remains especially important for nursing care facilities and post-acute units. Consistent turnover combined with a tight hiring market puts pressure on wages and staffing contracts. Investing in long-term retention or education pathways can reduce dependency on short-term or travel staffing solutions.
11. From 2021 to 2031, the direct care workforce is projected to add over 1 million new jobs.
Normally, this figure includes aides, assistants, and support roles essential to daily operations in both home and facility-based settings. With that scale of growth, relying on your current hiring model may no longer be viable. Many systems are now forming partnerships with training programs or local colleges to meet volume needs.
12. Home health and personal care aide jobs are projected to grow 20.7% and add 820,500 positions by 2033.
This rise is driven by an aging population and more chronic conditions like dementia, diabetes, and mobility loss. As acuity increases outside the hospital, these aides are doing more complex work, usually with little formal training or support.
That raises serious questions about safety, quality, and retention if systems don’t invest upstream. Addressing it means improving recruitment for home health aides, especially in rural or high-need counties.
Pro tip: Home healthcare isn't just in-person anymore. Virtual nursing options offer flexible solutions. Stay ahead by exploring the top telehealth nursing trends by reading our guide.
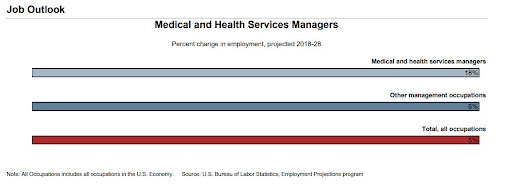
13. The employment of medical and health services managers is expected to grow by 18% from 2018 to 2028.
Of course, this growth reflects how much coordination and data oversight are now required to run even mid-sized facilities. Roles like these support strategic staffing, compliance, and performance tracking, especially when managing multiple care sites. Strong leadership in this area usually determines how effectively you use limited healthcare resources.
Healthcare Workforce Shortages: 2025 Data & Trends
Persistent shortages continue to limit how quickly providers can scale or stabilize services. These gaps are no longer isolated because they affect every part of the care pipeline, from training to bedside coverage. Below are the most urgent signals shaping your planning decisions now and over the next 5 to 10 years.
14. According to HRSA, the U.S. is projected to face a shortage of 78,610 full-time RNs in 2025 and 63,720 in 2030.
This shortfall represents a loss in full-time equivalents critical for meeting hospital and outpatient coverage needs. Facilities already struggling to meet mandated ratios or maintain specialized units will face even tighter constraints. Shortages on this scale require multi-year recruitment pipelines, not short-term shifts in job postings or travel nurse contracts.
15. HRSA also noted that Washington is expected to face a 26% RN shortage by 2035, with California close behind at 18%.
These regional gaps will create sharp disparities in care access, especially in rural areas and high-acuity units. Leaders in these states may need to adjust incentives, scope-of-practice policies, or interstate licensure strategies to manage the supply-demand imbalance. Workforce planning must be location-specific, not just system-wide.
16. HRSA notes that demand for direct care workers is rising fastest for psychiatric aides (59%), followed by nursing aides (48%), personal care aides (43%), and home health aides (42%).
Behavioral health, elder care, and chronic disease management are all driving this growth. These roles form the foundation of long-term care delivery but usually lack competitive wages or career paths. The result is high turnover and inconsistent hospital patient care, which increases risk and costs over time.
17. BLS reports that employment for home health and personal care aides is expected to grow 21% from 2021 to 2031.
That’s the equivalent of adding hundreds of thousands of new roles with minimal structural support in place. These positions are hard to fill and harder to retain, especially in regions without transit access or wage subsidies. Planning teams should factor in retention timelines when projecting FTE availability.
18. The American Association of Colleges of Nursing’s 2024–2025 report shows a national nursing faculty vacancy rate of about 7.9%.
This bottleneck slows down nursing education pipelines at a time when the field needs rapid expansion. Schools are being forced to cap enrollment or reduce clinical placements, despite high demand from applicants. Without faculty investment, the nursing profession will remain stuck in a slow-growth cycle that fails to meet future needs.
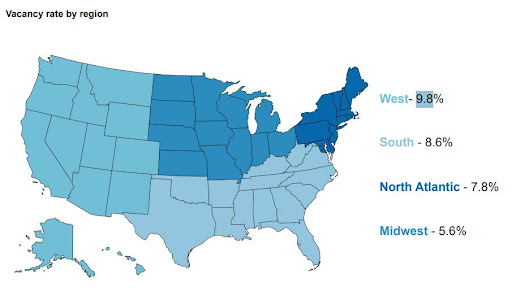
19. According to the same report, faculty vacancy rates vary by region, with the West highest at 9.8% and the Midwest lowest at 5.6%.
Regions with the greatest need for new nurses are usually the ones struggling most to expand their training capacity. This mismatch limits how quickly health systems can onboard entry-level staff locally. Workforce strategy must account for where students are trained, not just where jobs are posted.
20. A total of 80,162 qualified applications were turned away due to insufficient capacity and limited resources.
That number includes students who met academic and clinical criteria but were blocked by staffing, space, or funding limits. Each missed placement delays potential new hires by years, not months. Fixing this requires joint action from schools, funders, and employers to expand both faculty and clinical training slots.
21. According to the AACN, approximately 29,200 new Advanced Practice Registered Nurses (APRNs) are needed each year through 2032.
This includes nurse practitioners, CNMs, CRNAs, and clinical nurse specialists. Schools will need support to scale up faculty and clinical placements to meet demand. Health systems can help by offering teaching partnerships, residencies, or tuition-backed hiring programs.
Pro tip: Staffing shortages can strain your system’s resources and affect morale. Check out our list of 81 healthcare staffing statistics to stay ahead of trends and proactively address staffing risks
Burnout in Healthcare Personnel: Statistics & Impact on Well-Being
Burnout has become one of the biggest threats to workforce stability across care settings. As demand increases and staffing remains tight, mental and physical strain is pushing both experienced staff and new graduates out of the field. These are the most recent findings showing how burnout is shaping the future of the nursing workforce.
22. According to MyPerfectResume, 83% of nurses report feeling burned out at least weekly, with 36% saying they experience burnout every shift.
Weekly burnout affects nearly every shift schedule and adds pressure to maintain safe staffing levels. High emotional fatigue can lead to more sick days, reduced productivity, and disengagement. For executives and HR teams, this drives up costs tied to overtime, float pools, and turnover management.
23. The BEYOND THE BEDSIDE report shows that 65% of nurses report high levels of stress and burnout.
This finding shows the impact of systemic stress across settings, whether in acute care, long-term care, or outpatient clinics. Persistent burnout increases exit rates and also weakens team cohesion and patient communication. Addressing this trend requires structural changes to support health care workers at scale.
24. 67% of nursing students say they're already concerned about managing their workload.
Stress begins before licensure, which raises concerns about long-term retention of new graduates. If early-career nurses start with high burnout expectations, many may opt out of bedside roles within a few years. That adds pressure on education leaders to revisit clinical schedules, mentoring support, and medical training intensity.
25. The 2022 National Nursing Workforce Survey found that over 25% of RNs plan to leave nursing or retire by 2027.
This projected departure rate poses long-term risks for continuity, especially in rural hospitals and specialized units. Facilities that don’t actively track and manage exit patterns will likely face abrupt coverage gaps. To stay ahead, systems need to build succession plans and engagement strategies that align with both retirement timelines and organizational goals.
Healthcare Workforce Demographics & Diversity Stats
Workforce diversity plays a direct role in access, equity, and patient outcomes. To plan effectively, you need a clear picture of who makes up the care workforce today and how that’s shifting by gender, age, race, and origin. These are the latest demographic benchmarks shaping how you recruit, train, and retain across the healthcare sectors.
26. According to CrownCounseling, about 88.5% of RNs in the U.S. are female, with men accounting for approximately 11.2%.
This gender imbalance has remained consistent across decades and raises concerns about representation and inclusivity in leadership and clinical roles. Recruiting male candidates into the nursing workforce may help offset retirements and open new pipelines. It also improves the profession’s alignment with diverse patient populations and care preferences.
27. ScienceDirect reports that around 91% of LPNs/LVNs are female, while males make up about 9% of the workforce.
Licensed practical and vocational nursing shows even less gender diversity than RN roles. That limits potential hiring pools and may unintentionally shape perceptions of the profession. Education and outreach efforts need to challenge longstanding assumptions about who enters nursing and where they work.
28. The National Nursing Workforce Survey reports that the median age for both RNs and LPNs/LVNs is 50.
This signals that a large portion of the workforce is nearing retirement age, and replacements may not arrive fast enough. For systems already struggling to fill rotating shifts or cover 24/7 care models, aging staff only increases that pressure. Succession planning and cross-training are no longer optional.
29. According to the same survey, nurses under 35 make up 18% of RNs and 16% of LPNs/LVNs, while those 50 and older account for just over half of both groups.
That gap shows a growing age imbalance and signals possible leadership shortages in the next decade. Younger nurses will need faster access to mentoring, continuing education, and professional growth paths. Otherwise, high early-career exit rates will only worsen staffing volatility.
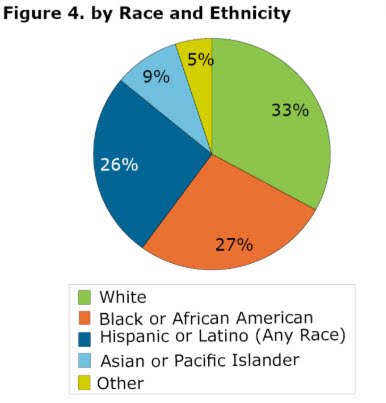
30. NCSBN reports that from 2022 to 2024, the share of White RNs dropped from 80% to 77%, while Black RNs increased from 6% to 9%.
This shift shows modest progress in workforce diversity, particularly among health workers who reflect the patients they serve. Ongoing changes in school admissions, hiring, and promotion practices will shape whether this trend continues. For DEI-focused leaders, tracking and reporting race-based composition data is now standard practice.
31. People of color represent 67% of home care workers, despite being just 38% of the overall U.S. workforce.
This overrepresentation raises concerns around compensation, equity, and support for front-line caring personnel. These workers usually take on physically demanding roles with little job security or advancement. Addressing these disparities can improve both care quality and workforce stability across states.
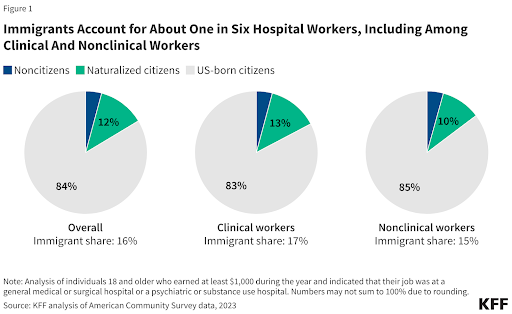
32. KFF reports that immigrants make up about 16% of all hospital workers, including 17% of clinical staff and 15% of nonclinical staff.
Foreign-born nurses and support staff remain essential to staffing continuity, especially in metro areas and high-vacancy specialties. As immigration policies tighten or shift, talent acquisition strategies must evolve alongside them. Your workforce planning should factor in visa timelines, credentialing needs, and sponsorship costs where applicable.
Healthcare Personnel Training & Development Trends
Ongoing education plays a key role in building a workforce that can meet future demand and deliver safe, efficient care. As retirements rise and care needs grow more complex, systems will need to track not just hiring, but how well their teams are trained.
These are the current trends shaping credentials, degree levels, and continuing education across the health workforce.
33. Based on current education trends, about 66% of RNs are expected to hold a BSN or higher by the end of 2025.
This shift reflects the push from many hospitals to meet Magnet standards or strengthen quality-of-care metrics. Hiring BSN-prepared staff can reduce complications and improve outcomes, but it also raises competition and salary expectations. Facilities without degree incentives may find it harder to attract and retain top talent.
34. Nurse.org reports that 23% of nurses hold an associate degree, while 17% have a master’s or higher.
These figures show that while bachelor’s degrees are becoming the norm, nursing degrees remain mixed. For leaders building specialty teams or advanced practice roles, graduate-level education levels may be a limiting factor. Planning for skills coverage across shifts must consider this credential variation.
35. According to the Direct Care Workforce 2025 report, 36% of direct care workers are high school graduates, while 24% have some college experience, 21% hold an associate degree or higher, and 19% have less than a high school education.
This educational range affects training timelines, onboarding complexity, and patient safety protocols. It also shapes how confidently workers manage care plans, document notes, or handle basic medical care tasks. Building modular, in-role training programs is one way to close these skill gaps quickly and affordably.
36. The same report shows that 70% of direct care workers say they want more training.
The demand is clear, but most current systems don’t offer structured development once initial orientation ends. Without support, these workers may leave or fail to meet care standards, which puts outcomes at risk. Investing in targeted upskilling, especially for aides and health care assistants, can directly reduce turnover and boost quality.
37. Across ABNS member organizations, nearly 930,000 registered nurses worldwide hold a specialty certification across various care settings.
These certifications are becoming a signal of quality, particularly in units like oncology, critical care, and perioperative nursing. Health systems that promote or sponsor specialty certification typically see stronger staff retention and engagement. The financial return can also show up in fewer readmissions and higher patient satisfaction.
38. Most U.S. states require RNs and LPNs to complete continuing education every two years for license renewal.
These requirements vary widely but set a baseline for keeping skills current amid changing protocols and technologies. Many states now accept online CEU platforms or provider-based modules to reduce access barriers. Making continuing education more flexible helps maintain compliance and improves long-term care consistency.
Pro tip: Training is just part of the equation. Recruitment strategies also determine how quickly you meet workforce needs. Strengthen your hiring approach with our must-follow best practices for nurse recruitment.
Healthcare Personnel Compensation & Benefits Statistics
Compensation remains one of the biggest drivers of retention, recruitment, and workforce satisfaction. Understanding what different roles earn and what benefits contribute to total employer costs helps you build smarter budgets and more competitive offers. These are the latest compensation benchmarks for the nursing workforce and broader healthcare staff.
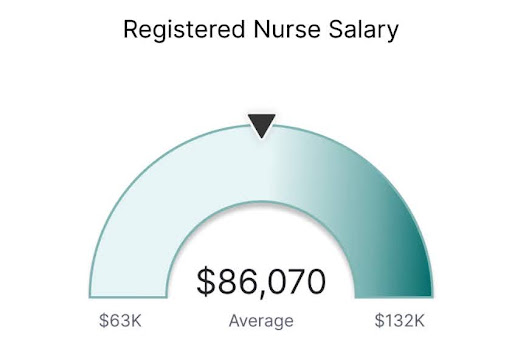
39. As of March 19, 2025, the median salary for registered nurses in the U.S. is $86,070.
Salary ranges remain wide because the top 10% of RNs earn $132,680 or more, while the bottom 10% earn $63,720 or less. Location, specialty, and shift type all influence pay, especially in unionized systems. Aligning offers with regional and role-based benchmarks can prevent turnover and reduce reliance on temporary staffing.
40. LPNs and LVNs in the U.S. earn an average of $29.23 per hour, or $60,790 per year.
While lower than RN pay, this rate typically supports skilled nursing coverage in technical occupations like rehab, long-term care, and post-acute settings. For facilities balancing wage constraints with high-volume care needs, this segment provides cost-effective staffing with stable licensure.
41. According to the Bureau of Labor Statistics, the median yearly pay for nurse anesthetists, nurse midwives, and nurse practitioners is $132,050.
This pay reflects both advanced degrees and high patient care complexity in these roles. Systems aiming to expand primary and OB/GYN care usually depend on these advanced practice providers, which makes them central to cost-containment and access planning strategies.
42. Certified nursing assistants earn an average salary of over $30,000.
However, sign-on bonuses usually exceed $3,000 in high-turnover areas. Low wages continue to drive high attrition in CNA roles, making retention strategies like shift flexibility, attendance bonuses, or internal career ladders critical to maintaining healthcare practitioners at the bedside.
43. In 2025, home care aides earn a median annual salary of approximately $33,585.
That wage remains below national averages, despite rapid job growth and rising demand from aging patients. Systems expanding home-based care need to factor in additional incentives like paid mileage, hazard pay, or tuition reimbursement to attract stable, long-term aides.
44. The median yearly wage for healthcare practitioners and technical roles is around $83,090.
This category includes physicians, dental hygienists, and registered nurses. Workforce planners should break out this group when modeling retention risk, as higher-paid staff often drive more costly vacancies and extended hiring timelines.
45. According to Table 2 at the Bureau of Labor Statistics, employers in the health care and social assistance industry spent an average of $48.50 per hour on employee compensation.
Of that, $33.84 goes to wages and $14.66 to benefits, which is split across paid leave ($4.20/hour), supplemental pay ($1.69), insurance ($3.71), retirement ($1.76), and legally required costs ($3.30). For hospital executives and workforce planners, this breakdown is critical to evaluating where compensation packages fall short compared to competitors.
If you're managing rising turnover or unfilled roles in entry- and mid-level care positions, it may signal that your benefit structure (not just wages) needs rebalancing. Use this data as a benchmark to revisit how total rewards align with retention goals and budget constraints.
46. The table showed that in the broader education and health services industry, total compensation averaged $54.30 per hour, with $36.93/hour in wages (68%) and $17.37/hour in benefits (32%).
Within that, insurance costs ($4.79/hour) and retirement savings ($3.87/hour) form the bulk of non-salary spending. For HR leaders managing multi-site networks or union contracts, this data provides a benchmark when assessing benefit parity across roles.
If you're negotiating with agency partners or reviewing internal cost structures, these figures help justify shifts in contribution levels or rebalance offers for hard-to-fill clinical and technical positions.
47. Another thing that we saw is that the total compensation averaged $68.53 per hour, with $44.89/hour in wages (65.5%) and $23.64/hour in benefits (34.5%) at hospitals.
Hospitals see the highest share of paid leave and insurance costs, totaling $6.67 and $6.01 per hour, respectively. For CFOs and clinical operations teams, this reinforces why frequent turnover drives up costs, especially when backfilling with travelers or contract labor.
Strengthening internal career ladders, retention bonuses, and flexible scheduling may offer better long-term value than recurring agency fees.
Pro tip: Employee compensation and benefits directly impact your recruitment and retention outcomes. Get a deeper understanding of the real costs behind hiring decisions with our report on healthcare recruiting and retention costs.
48. According to Table 4 of the Bureau of Labor Statistics, for registered nurses (civilian workforce), total employer costs were $76.69 per hour, including $50.14/hour in wages (65.4%) and $26.56/hour in benefits (34.6%).
This covers paid leave ($7.47), insurance ($6.25), and retirement ($4.12). For HR and finance leaders in health systems, these figures offer a baseline to assess competitiveness, especially in retaining mid-career nurses who are weighing total compensation across regions or sectors. If your benefits lag national averages, that gap can erode retention even when base pay looks strong.
49. That same table showed that in the private sector, registered nurses cost employers $78.06 per hour, with $51.05/hour in wages (65.4%) and $27.02/hour in benefits (34.6%).
Breakdowns show that paid leave costs are $7.73/hour, and insurance is $6.17/hour. For executives in private hospitals and networks, this data confirms the financial pressure of staying competitive in high-demand markets.
To retain experienced nursing workforce talent, your strategy may need to go beyond base pay. You'll need to focus on tuition assistance, credentialing support, and internal advancement pathways.
50. We also noticed that in nursing and residential care facilities, total compensation averaged $32.90 per hour, with $23.93/hour in wages (72.7%) and $8.97/hour in benefits (27.3%).
That includes paid leave and insurance, accounting for $2.33 and $2.52 per hour, respectively. For operators in long-term care, the lower benefit spend reflects funding constraints that directly affect recruitment and retention.
Offering structured referral bonuses, predictable shifts, or training reimbursements can help offset limited financial flexibility and still appeal to your healthcare workforce.
Advanced Practice Growth: Nurse Practitioners & Beyond
The expansion of advanced practice roles continues to reshape frontline care delivery, especially in underserved areas. Nurse practitioners (NPs), certified nurse-midwives (CNMs), and nurse anesthetists (CRNAs) now play a key role in offsetting primary care shortages and expanding access.
These are the most relevant data points shaping your long-term workforce planning.
51. The HRSA Health Workforce Simulation Model documentation notes that 88% of NPs are certified in primary care and 70.3% actually deliver primary care.
This gap between certification and active practice highlights the pressure placed on NPs to fill front-line gaps. In areas with primary care physician shortages, system leaders are shifting care team models to prioritize NP recruitment and supervision ratios. It also shows the importance of aligning role utilization with community demand.
52. According to the American Association of Nurse Practitioners (AANP), NPs represent around 1 in 4 primary care providers in rural practices.
Normally, this share is even higher in some remote counties where hospitals rely on advanced practice providers as the primary point of care. For rural health system administrators, this reinforces the need to build local NP pipelines through partnerships with regional nursing education programs. It also makes full-practice authority a legislative priority.
53. According to 2025 U.S. Bureau of Labor Statistics figures, there are just over 50,000 nurse anesthetists (CRNAs) in the United States.
While not growing as fast as NPs, CRNAs remain essential in both surgical centers and critical access hospitals. Many facilities now rely on CRNAs for procedures once handled by anesthesiologists, especially in markets facing physician shortages. Credentialing and recruitment policies should reflect these shifts in care delivery patterns.
Pro tip: Changes to CRNA educational requirements are shifting the landscape in anesthesia staffing. Therefore, make sure to stay informed about the CRNA doctorate changes with our detailed update.

54. In 2025, there are around 14,200 CNMs out of a total of approximately 17,000 midwives (including CMs and CPMs) nationwide.
As maternal health access becomes a national concern, CNMs are increasingly embedded in OB/GYN and family medicine teams. Systems that integrate CNMs into prenatal and delivery services usually see improved patient outcomes and reduced costs. That makes midwife workforce planning critical for hospitals addressing birth equity goals.
55. NurseJournal reports that in the U.S., 30 states and territories grant full practice authority to NPs, 15 limit it with reduced autonomy, and 11 require physician oversight through restricted practice laws.
This patchwork has direct implications for system operations, hiring costs, and provider deployment. Executives managing multi-state networks must factor in compliance and credentialing complexities when expanding NP care teams. Workforce strategies should account for regulatory friction that may limit NP productivity across state lines.
56. NP‑specific programs reported a 12% enrollment bump from 2023 to 2025.
Expanded autonomy and new specialties in psychiatric mental health, adult gerontology, and family care largely fuel this surge. Academic institutions report increasing demand for online and hybrid NP training formats. For health systems, this growth presents an opportunity to invest early in pipeline partnerships and develop clinical rotation capacity.
Turnover Rates & Labor Activity in Healthcare
High turnover continues to drain staffing budgets, disrupt continuity of care, and push existing teams toward burnout. Leaders who track patterns early can respond with data-backed hiring plans and better retention strategies.
These are the most current turnover and labor statistics influencing planning decisions for 2025 and beyond.
57. The 2025 NSI National Health Care Retention & RN Staffing Report showed that hospital CNA turnover hit 41.8%.
This churn rate significantly strains shift coverage and raises overtime costs. For staffing firms and operations teams, it typically means reassigning float staff or rehiring for the same roles every few months. Systems with CNA mentoring or upskilling tracks tend to see better stability.
58. According to NCSBN, 39.9% of RNs and 41.3% of LPN/VNs plan to leave or retire within five years.
Of course, this level of attrition affects both inpatient units and post-acute settings. Health systems must start modeling these exits against local pipeline data to avoid overreliance on travelers. Organizations that pair phased retirement with knowledge transfer programs usually see smoother transitions.
59. Nearly 800,000 Registered Nurses (RNs) intend to leave the profession by 2027.
This figure highlights how retention affects senior nurses with deep institutional knowledge. Leadership should look at ways to retain experienced RNs in mentorship or training roles, even if they scale back clinical hours. These roles support onboarding while protecting productivity.
60. Approximately 184,000 Licensed Practical/Vocational Nurses (LPNs/LVNs) are expected to exit the field by 2027.
LPNs and LVNs form the backbone of staffing in long-term care, skilled nursing, and home care. With exits rising, some organizations are revisiting the viability of LPN-to-RN bridge programs. These strategies help retain loyal staff while filling RN gaps internally.
61. An estimated 17.5% of newly licensed RNs leave their first nursing job within one year of starting.
That early-tenure attrition creates repeated onboarding costs and increased risk of safety lapses. Organizations using buddy programs or structured residency models can see stronger retention during the first 12 months. Data should guide which units or shifts see the highest new nurse exits.
62. According to the Early-Tenure Nurse Retention report, managers with 30 nurses see a 27% early-tenure turnover rate, compared to 40% for those managing 90.
This points to workload-driven turnover at the leadership level. When nurse managers are stretched too thin, direct reports lose access to support and feedback. Some systems need to invest in assistant nurse manager roles to reduce span-of-control and improve staff retention.
Pro tip: Turnover impacts nurse managers as well, which creates broader staffing instability. Check out our article about HR trends in Healthcare to better support your management team.
Final Thoughts: Building a Workforce Strategy That Lasts
Staffing challenges are structural. To plan ahead, you need more than job boards and one-off contracts. You need a partner who understands nurse pipelines, compensation trends, early-tenure turnover, and long-term planning.
AAG Health helps you address gaps with targeted clinical recruitment, flexible staffing models, and full RPO services built around your needs. Whether you're a hospital administrator managing surge coverage or a nursing school leader facing capacity issues, our team works beside you.
Talk to AAG Health about how strategic staffing and consulting can support retention, cost control, and continuity of care across your organization.
