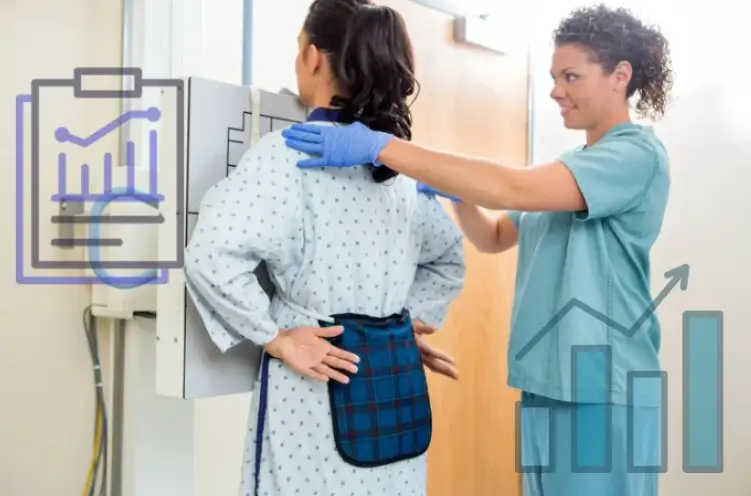
Your radiology team may be reading more scans than ever, but are they reading the right ones, fast enough, and without burning out?
As imaging volumes surge and complexity rises (think multiparametric MRI, advanced CT protocols, and hybrid modalities), hospitals are under pressure to deliver faster diagnoses within tighter margins to meet higher expectations.
Yet most HR executives and hospital leaders don’t have a clear playbook for measuring radiologists in a way that’s fair, motivating, and aligned with institutional goals.
That’s where radiology productivity metrics come in.
Implemented poorly, these metrics can pressure teams, leading to burnout, quality lapses, and turnover. But smartly designed, they become a strategic tool to help you recruit the right people, reward consistent performers, and spot overload before it breaks your team.
Here are a few guiding stats to set the stage:
- In a benchmark report by the Imaging Performance Partnership, there was a significant difference in CT report turnaround time between the 75th percentile and 25th percentile facilities, which means many hospitals have major headroom to improve speed by following the right KPIs.
- According to the Global Radiologist Report 2025, 53% of radiologists said burnout was their top concern, followed closely by workforce shortages. Pressuring doctors to meet problematic KPIs can only exacerbate this issue.
So here's the promise: in this article, we’ll:
- Walk through the most important radiology productivity metrics
- Unpack what each one really means for patient care, cost, morale, and growth
- Show you how to use those metrics in hiring and retaining radiologists who push performance without breaking your team.
Let’s dive in.
P.S. Alpha Apex Group Health has an 80% candidate placement success rate and up to 55% faster recruiting turnaround. If you’re ready to strengthen your radiology team, we’ll help you find the right fit, faster.
What Are Radiology Productivity Metrics?
Radiology productivity metrics are the tools hospitals, imaging centers, and health systems use to measure how effectively radiologists and imaging operations produce value.
These metrics go beyond just how many scans a radiologist reads; they’re about balancing volume, speed, accuracy, resource use, and quality.
In short:
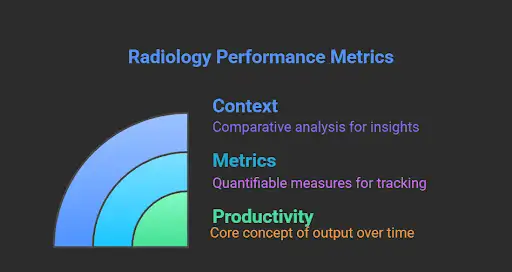
- “Productivity” = output over time, but in radiology, that output has many dimensions (complex cases, reporting speed, non‑interpretive tasks)
- “Metrics” are the specific, quantifiable measures (e.g., RVUs, turnaround time) you use to track, compare, and guide performance
If we combine the two, we realize one important thing:
The real power of these metrics lies in context. That means comparing performance:
- Across radiologists
- Across time (trend)
- Against benchmarks (internal or external)
This matters because in imaging, subtle inefficiencies can really start to snowball.
Reporting delays slow down downstream clinical decisions. Overloading radiologists causes errors or burnout. Underutilized scanners waste capital.
Metrics let you see those leaks; fix them, and make smarter staffing decisions.
Layers of Productivity in Radiology: Volume, Process, and Outcome
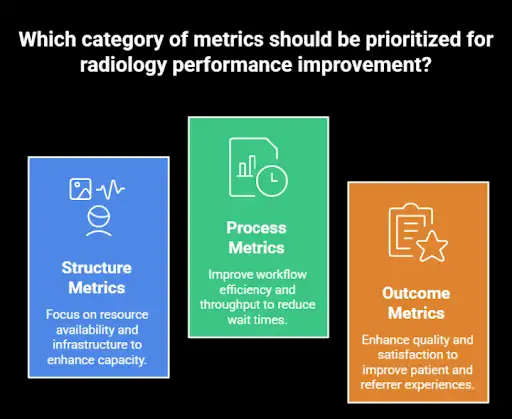
A useful framework splits metrics into three categories (borrowed from the Donabedian model of care, adapted for imaging): structure, process, and outcome.
- Structure/ resource metrics: the resources you have, like the number of radiologists, scanners, modality mix, and staff support
- Process/ throughput metrics: how work flows, for example, turnaround times, caseload, and queue management
- Outcome/ quality metrics: the final impact of things like error rates, peer-review results, patient/referrer satisfaction
Keep in mind that no one metric captures everything; you’ll want a balanced dashboard. But that brings us to the next point:
Tracking Radiology Productivity with Metrics Is Harder Than It Looks
When it comes to measuring radiology productivity, there are several moving parts that complicate things.
For starters, a radiologist’s day isn’t just spent reading images.
Non-interpretive tasks usually go uncounted, even though they eat up real time and energy. These include:
- Consulting with physicians
- Participating in multidisciplinary team meetings
- Teaching
- Handling admin duties
Then there’s the variability in case complexity: two radiologists might both read 50 studies in a day, but if one is focused on complex MRIs and the other is reviewing routine X-rays, their workload is anything but equal.
On top of that, different hospitals use different tech stacks in terms of PACS, RIS, and reporting tools.
All these impact workflow and productivity.
A metric like turnaround time might look great in one system and lag in another, even if the actual work being done is similar.
To put things into perspective, there’s a wide variation in the median number of annual imaging procedures per full-time technologist, which is a reminder that productivity isn’t a one-size-fits-all metric.
It’s even more difficult to compare these metrics if you’re interested in teleradiology staffing.
And then there’s the issue of timing: final report times might be delayed due to edits, late addenda, or sign-off cycles, all of which make it tricky to capture a clean, reliable measure.
Meanwhile, studies have shown that longer radiology turnaround times are directly linked to longer hospital stays, lower patient satisfaction, and gridlocked care pathways.
So you will need to find a way to track and optimize that timing consistently.
Despite the messiness, radiology productivity metrics are incredibly valuable for seeing where performance is strong, where support is needed, and where things are slipping through the cracks.
So, let’s see:
Key Radiology Productivity Metrics
Now that we’ve covered the what and why behind radiology productivity metrics, let’s dig into the most important ones to track. These are the numbers that shape day-to-day operations and also give hiring managers the insight they need to bring on the right talent and keep them.
RVUs (Relative Value Units)
This is perhaps the most commonly used “currency” for measuring radiologist output. An RVU is supposed to reflect the time, skill, and intensity required to interpret a study (or perform a service). In many U.S. systems, radiologists are evaluated or compensated partly on “work RVUs.”
What it means for the hospital
RVUs let you compare across modalities and standardize output expectations. Because CPT codes are mapped to RVUs, you can normalize whether someone reads MRIs or plain films.
They tie closely to reimbursement: the “work” component of RVUs is recognized in many payor systems, so you’re aligning productivity with revenue.
But RVUs have limitations.
They tend to undervalue non‑interpretive work (teaching, consulting, admin). Some studies have found that two radiologists could log the same RVUs yet differ markedly in how much time or effort they spent.
Because of those limitations, some argue for or supplement with time‑based metrics (e.g., “study‑ascribable time”) that explicitly account for how long each task actually takes.
What this metric means for hiring and retention
- When interviewing or negotiating, ask candidates about their historical RVU productivity (if available), but also about how much non‑reading work they did.
- Be wary of rigid RVU quotas without a buffer for other tasks, since this can lead to burnout or cutting corners.
- Consider hybrid or flexible compensation models: base salary, RVU bonuses, and credit for nonclinical contributions like teaching, admin, and committee work.
Turnaround Time (TAT)
TAT measures how quickly imaging studies are reported from the moment they’re complete to when the final report is available to clinicians. It’s a process metric, which means it’s a reflection of throughput and operational efficiency.
What it means for the hospital
- Faster TATs help clinical decision-making via quicker diagnoses, fewer bottlenecks, and smoother patient flow.
- Long TATs can translate into higher inpatient lengths of stay, delays in treatment, and dissatisfied referring physicians. Some benchmarking reports, like the above-cited Imaging Performance Partnership, show wide gaps. However, you can use these turnaround time reports to see how your facility stacks up by modality, region, and hospital size.
If you want to improve radiology TAT, we recommend starting with this video:
The main advantage of TAT is that it’s easy to communicate: it’s something executives, clinicians, and patients understand (faster = better).
Unfortunately, it can also be gamed, for example, through superficial reads to hit targets, delaying complex work, ignoring addenda, or if it’s not tied properly to quality metrics and incentives.
What this metric means for hiring and retention
- In job descriptions, be transparent about expected TATs (e.g., for emergency CT, inpatient MRI, or outpatient reads).
- During interviews, ask candidates how they prioritize or manage urgent vs routine reads.
- Use TAT monitoring to identify when someone is over-committed or struggling, rather than waiting until burnout shows up.
Case Volume (Read Volume)
This is the raw count of studies or exams a radiologist handles over a given period (day, week, or month). It’s the simplest “throughput” metric.
What it means for the hospital
Volume gives you baseline output data on how many studies your team can realistically process with the given staffing and systems.
But volume must be contextualized with complexity. One radiologist doing mostly plain X-rays, reading 100/day, is not equivalent (in effort or value) to someone doing 40 high-end MRI studies with complicated protocols.
That’s why we advise you to track volume over time. That way, you will detect trends, seasonal swings, or operational saturation.
What this metric means for hiring and retention
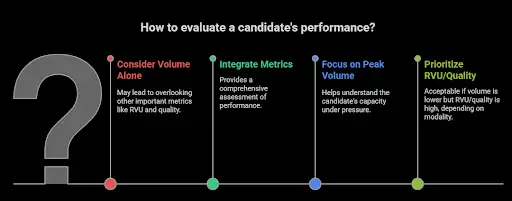
- Don’t fixate on volume alone. Use it with RVU, TAT, and quality metrics in interviews or performance assessments.
- When hiring, get a sense of both average and peak volumes the candidate has handled.
- If someone’s volume lags relative to peers but their RVU or quality is high, that may still be acceptable (but it depends on modality).
Modality Mix & Case Complexity
This captures which kinds of studies a radiologist handles (CT, MRI, ultrasound, mammography, interventional, etc.), and how complex those cases are (contrast-enhanced, multiphase, fusion imaging, and so on).
What it means for the hospital
Modality mix affects your staffing plan: you need radiologists who cover breadth (versatility) or depth (specialists).
Side note: This clip explains the variety of imaging modalities and the images they produce:
Of course, complexity must be weighted, which means more complex studies should “count more” in your productivity models.
Otherwise, a skewed modality mix (too many simple reads) can mask the underuse of your more advanced imaging capabilities.
What this metric means for hiring and retention
- Be explicit about expectations on modality coverage in job descriptions (e.g., “will read body MRI, CT, and fluoroscopy”) so candidates know what’s expected.
- For subspecialists, make sure your metrics account for the fact that their volume may be lower, but complexity higher.
- Allow for flexibility: consider whether radiologists can rotate modalities or specialize, so that the workload is diversified and burnout is mitigated.
Quality, Peer Review & Error Rates
You can’t ignore quality. A high‑volume, high-speed radiologist is worthless (or dangerous) if their error rate is unacceptable. Metrics here include discrepancies, peer review grades, addenda, and report revision rates.
What it means for the hospital
Following quality metrics protects patient safety, institutional reputation, and liability exposure.
That’s because they serve as a check on productivity metrics. If TAT or volume is up, but quality slides (and you get many error rates), that’s a red flag.
Unfortunately, radiology errors are common; here’s how they produce:
We also advise you to track peer review trends to identify training needs, system issues, or pathological weaknesses in the workflow.
What this metric means for hiring and retention
- Ask candidates about their historical peer review performance or error rates (if available).
- Build a balance into compensation or evaluation systems. Productivity and quality must both be part of the equation.
- Use quality metrics as positive reinforcement. Recognize radiologists who maintain excellent performance.
Worklist and Workflow Efficiency (Queue Management, Bottleneck Metrics)
This is about how effectively a radiologist handles their work backlog. You would look at the number of pending reads, aging studies, reassignments, and how they manage their queue. It includes internal flow metrics, such as how many studies sit for more than X hours before being touched.

What it means for the hospital
Workflow metrics reveal hidden inefficiencies, like a system where studies wait for batching, or priority cases get delayed because of poor queue triage.
Tracking them helps you understand load balancing: if several radiologists have huge queues and others have “clean” lists, there’s a staffing mismatch or triage issue.
These metrics can drive workflow redesign, better use of assistants/pre-readers, or tech interventions.
What this metric means for hiring and retention
- During interviews, ask how candidates prefer to manage their queue or how they triage urgent vs routine work.
- Radiologists with strong organizational habits often excel in busy environments.
- Use these workflow metrics to flag when someone is getting overloaded (before burnout sets in).
How to Implement Radiology Metrics
Here’s a quick framework to make sure you implement the right radiology metrics correctly:
- Build your “core metric dashboard:” Pick 4–6 metrics you’ll track consistently (e.g., RVU, TAT, quality, and workflow).
- Gather benchmark data: Compare your team’s performance internally and against national or peer benchmarks to identify gaps or opportunities.
- Embed metrics into hiring: Include metric history in candidate evaluation, define expectations openly, and structure compensation around fair targets.
- Use metrics proactively for retention: Monitor trends, catch overload early, reward achievement, and revisit goals periodically.
- Pilot tech enhancements: Whether it’s AI triaging, automated QA, or dashboards, start small, measure impact, and scale what works.
- Engage your radiologists: Make them co‑owners of the metric system. Get feedback, align incentives, and iterate together.
Metrics shouldn’t feel like weights dragging your team down. Used well, they’re accelerators that give you visibility, insight, and control. With smart hiring, thoughtful retention, and the right tools, your radiology department can be efficient and oriented toward team health.
How to Use Radiology Productivity Metrics in Hiring & Retention
Once you’ve settled on your metric dashboard (RVUs, TAT, quality, modality mix, workflow, etc.), the next step is applying those numbers in real-world talent decisions.
The goal: hire radiologists who are set up to succeed, and keep them motivated long term.
Pro tip: Not sure how to get started? We’ve analyzed the best radiology recruitment firms to find the best candidates for your needs.
Hiring: Use Radiology Metrics to Choose the Right Fit
To use radiology metrics in hiring, follow the five steps below.
1. Ask for data (with context) on a candidate’s past metrics
Don’t just ask, “How productive are you?” Instead, request actual numbers like average RVUs per year, TATs in prior roles, and volume by modality. Then dig into context: “How many nonclinical hours did you do? In what kind of system?” Metrics without context are dangerous.
2. Use metrics to calibrate expectations and set realistic targets
Compare a candidate’s past performance to your institution‑specific benchmarks. If your TAT targets are stricter than where they worked before, you’ll need to factor in ramp time or support. Use those metrics to shape their job offer. Base salary, bonus thresholds, and performance goals should all tie back to agreed metrics.
3. Use metrics to evaluate “stretch” candidates
Sometimes the best candidates aren’t the ones who already check every box but those who show rising trends in their productivity, adaptability across modalities, or excellent quality under pressure. Metrics can help you see potential instead of fixating on what’s already checked off.
4. Design metric‑based (but balanced) compensation plans
Offer a structure where the radiologists’ base pay is stable, but bonuses or incentives kick in when people exceed benchmark metrics (e.g., above a certain RVU threshold, maintain TAT under a target, keep error rates low). But be careful: if the incentive is too steep or the targets unrealistic, people might cut corners or burn out.
5. Be transparent up front
When recruiting, be clear about which metrics matter at your institution (e.g., “We expect average daily RVUs of X, and you’ll be evaluated on TAT and discrepancy rate”). Candidates should have no surprises. This transparency helps set mutual expectations and reduce future conflict.
Retention: Keep Radiology Metrics From Becoming a Sword
Metrics can help retention if done thoughtfully, but they can be a cause for resentment if used poorly. Here’s how to make them a tool, not a weapon.
1. Use metrics as an early warning system, not just a report card
If you notice someone’s TAT creeping, or their backlog growing disproportionately, use it as a signal to offer help (rebalancing load, adding support tech, mentorship) before frustration builds. Don’t wait for a radiologist to burn out.
2. Recognize and reward above‑and‑beyond performance
Metrics should be part of recognition. Radiologists who consistently maintain strong performance across multiple metrics deserve praise, bonuses, or opportunities for advancement. It signals you care about effort, not just output.
3. Balance metrics with flexibility and buffer room
Metrics should guide rather than dictate every minute. Allow for “breathing room” for teaching, admin, conferences, research, or unexpected clinical demands.
4. Regularly review and adjust metrics
Workflows change, tech improves, and staffing shifts. The targets or weights you set at the start might become outdated. Hold periodic reviews to get feedback from radiologists about what’s realistic, fair, and useful.
5. Tie in professional growth and co‑ownership
Don’t treat metrics as purely top‑down. Let radiologists participate in defining their metric goals, share the rationale behind benchmarks, and engage them in process improvements. This builds buy-in and trust.
6. Monitor for metric fatigue or unintended consequences
Watch out for behaviors like “hitting the metric but gaming it” (like ignoring complicated reads to push simple ones or delaying complex ones until after quotas). Use quality and peer‑review metrics in tandem with productivity.
Tech, Tools & Automation: Use Productivity Metrics Correctly
If your metrics are the compass, your technology is the engine that drives performance forward. With the right tools like AI, automation, and workflow analytics, you’re actively improving productivity instead of just tracking it.
But not all tech is created equal, and poor implementation can just add noise. Here’s what we advise you to focus on:
AI and Smart Prioritization
AI has made big strides in helping radiologists manage workload more intelligently. For example, systems that prioritize chest X-rays based on critical findings, like pneumothorax, have been shown to significantly reduce average turnaround times. One study found that using AI triage dropped report times from about 80 minutes down to 35 minutes for urgent cases.
Automating Quality Assurance
Quality assurance can be one of the most time-consuming and emotionally loaded parts of radiology. AI tools that flag discrepancies between imaging and reports are helping automate this and drastically cut down on the need for manual review.
For example, in one test, a system cut the QA effort by 98.5% while still catching clinically relevant misses. That’s a big win in terms of scaling quality control without burning out your team.
Real-Time Dashboards and Analytics
Many leading radiology departments are now using live dashboards that track things like TAT, backlog size, and aging studies. These tools give you a bird’s-eye view of operations and help shift from reactive firefighting to proactive planning.
When you see issues in real time, like studies aging in a certain modality or radiologist queues piling up, you can make changes to staffing or priorities faster.
Surge Staffing and Redistribution
Some hospitals are bridging capacity gaps by combining supplemental remote reads with internal redistribution tools.
This "surge staffing plus smart routing" model has helped larger systems manage sudden spikes in volume without overwhelming their core teams.
A recent study in JACR outlined that, indeed, this approach can buy time while you recruit for long-term coverage.
What to Watch Out For
Of course, tech only works if it fits into the workflow. If your new AI tool doesn’t integrate with PACS or adds too many clicks, adoption will tank. Integration should feel invisible. Radiologists shouldn't have to think too hard about how to use the tool, just that it makes their job easier.
There’s also the risk of over-automation. If you lean too hard on AI without oversight, you can miss edge cases or introduce bias. It’s important to think of AI as an assist, not an autopilot.
And don’t forget the human side.
Even the best tech needs training, change management, and buy-in. Give your radiologists the tools and time they need to adapt. Let early adopters lead the charge and feed their input back to developers. You’ll also need to budget for maintenance, updates, and scaling as your needs change and grow.
Finally, make sure your tech investments are measurable. Post-deployment, check if your key metrics like TAT, volume, and accuracy actually improved. If they didn’t, adjust. Metrics and tools should evolve together.
Final Thoughts: Make Metrics Work for Your Radiology Team
Radiology productivity metrics, when thoughtfully chosen and implemented, become powerful tools that help you hire smarter, manage better, and retain your best talent. But they’re not magic. The secret is using them thoughtfully.
Here’s what you need to remember:
- The right mix of metrics matters. No single measure (RVUs, TAT, volume, quality, workflow) captures everything. A balanced and complete dashboard protects against blind spots.
- Context is king. Always take the environment into account when looking at metrics: pay attention to modality mix, nonclinical tasks, system constraints, and practice setting.
- Metrics should guide, not punish. Use them as signals to support, not scorekeep. When you spot someone slipping, jump in early with help instead of judgment.
- Tie metrics to real incentives, but be sure to keep it fair. Your compensation models should reward excellence without forcing radiologists into unethical tradeoffs.
- Tech is your ally, not your replacement. Automation and AI can lift the ceiling, but they need to be deeply integrated and co-created with users.
- Update your metrics over time. As your practice, tech, and team change, your metric priorities should too. Keep evaluating what’s relevant and what’s not.
If you’re looking to make sense of which radiology metrics actually matter for your team, that’s where Alpha Apex Group Health comes in.
We help hospitals and imaging centers find radiologists who truly fit their culture and lift team productivity.
Beyond recruiting, our team runs culture assessments, internal audits, and even original research to map your performance against industry benchmarks. The goal isn’t to drown you in numbers, but to make sure you’re tracking the ones that move the needle for your department.
Curious how your team compares? Reach out today. We’ll walk you through what great performance looks like in 2025 and how to get there.
FAQ: Important Radiology Metrics
1. What are the most important metrics for managing a radiology practice?
Key metrics for any radiology practice include RVUs, turnaround time, error rates, modality mix, and workflow efficiency. Tracking these helps radiology groups balance physician productivity with quality care.
2. How can radiology practices improve physician productivity without causing burnout?
Smart practice management means aligning workloads with staffing, using artificial intelligence to triage urgent cases, and recognizing non-interpretive tasks. This helps maintain physician output while protecting well-being.
3. What role does the American College of Radiology play in defining productivity standards?
The American College of Radiology (ACR) offers benchmarking data, quality metrics, and guidance on ethical productivity tracking. Their resources support both private and academic practices in balancing efficiency and care.
4. How should reimbursement rates factor into radiology productivity metrics?
Productivity should be tracked with reimbursement rates in mind, especially since the Centers for Medicare & Medicaid Services (CMS) reimburses based on CPT codes linked to RVUs. This ensures your Department of Radiology stays aligned with revenue expectations.
5. How can clinical productivity be measured across different modalities?
Clinical productivity should factor in study complexity, not just volume. A weighted system using RVUs and modality-specific targets can give you a more accurate view of a radiologist’s contribution.
6. Should radiology residents and trainees be held to the same productivity standards?
No. Radiology residents and radiology trainees are still learning, so the focus should be on education, gradual exposure, and quality improvement, not raw volume or TATs. Radiology residency programs should prioritize growth over quotas.
7. How does artificial intelligence impact productivity in radiology groups?
Artificial intelligence can boost efficiency by automating routine reads, flagging critical results, and managing worklists. It helps radiology practices hit productivity targets without overloading physicians.
8. What’s the best way to handle critical results reporting?
A reliable communication system is essential. Best practice includes closed-loop notifications, time-stamped delivery, and consistent documentation. Critical results reporting is a key part of both quality and risk management.
9. How do healthcare providers ensure fair comparisons of physician output?
To ensure fair assessment, healthcare providers should normalize for modality, case complexity, and non-clinical workload. Using RVUs and peer benchmarks helps avoid skewed interpretations of physician output.
10. What metrics matter most in an academic practice or teaching hospital?
In an academic practice, metrics should blend clinical performance (like RVUs and TAT) with teaching load, mentorship, and research output. Radiology trainees must be factored into productivity modeling thoughtfully.
