
Every radiology department walks a financial tightrope. Hospitals invest millions in MRI and CT scanners, PACS systems, and maintenance contracts, yet reimbursement rates keep shrinking.
Even a small percentage cut in Medicare’s RVU or GPCI values can erase margins overnight.
Over the last decade, adjusted for inflation, most imaging codes have seen reimbursement decline. CMS’s 2024 schedule brought another 1–2 % reduction in diagnostic radiology RVUs, while capital and staffing costs continue to rise. For hospital and clinic leaders, understanding how these forces interact is essential for survival.
This article breaks down:
- The major cost drivers in radiology, including equipment, staffing, infrastructure, and compliance
- How RVUs, GPCIs, and reimbursement rates shape revenue and profitability
- How innovation, AI, and teleradiology add both opportunity and cost pressure
Let’s look at what truly makes up radiology’s cost structure, and where hidden expenses often live.
What Goes Into Radiology Costs?
Before you can manage or optimize costs, you’ve gotta see what you’re carrying. Radiology is heavy on both fixed and variable cost drivers, and those can shift a lot depending on your setting (hospital vs outpatient clinic vs imaging center). Here’s how to break it down.
1. Fixed and Capital Costs
These are the big, often upfront investments and long‑term commitments. You can’t escape them, but you can plan carefully.
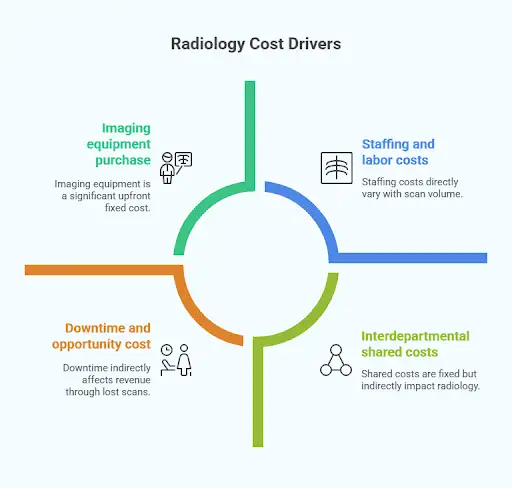
Imaging equipment purchase and installation
Radiology gear demands constant attention. Even the fanciest MRI or CT machine will fail if neglected. That’s why most U.S. imaging departments sign on for full-service maintenance contracts. In the U.K., 29% of radiology departments report equipment breakdowns monthly, 14% weekly. Maintenance contracts often cost 10–15 % of the equipment’s capital cost per year, depending on complexity and vendor.
Depreciation and amortization
You’ll spread the equipment cost over its useful life (say, 7-10 years), but you still need to plan for replacement. You also need to monitor how technological obsolescence (e.g., the arrival of newer, faster, more efficient models) eats into your residual value.
Facility and real estate costs
Whether you build new or retrofit, you’ll pay for square footage, structural improvements, utility infrastructure, and environmental controls (such as cooling and vibration damping). Some imaging centers report annual fixed lease/rent plus facility-related costs in the tens of thousands of dollars, depending on location and size.
Software, licensing, and PACS/IT systems
On top of the machine itself, you need image storage, archiving, retrieval, network connectivity, security, upgrades, and vendor licensing. These are recurring fixed (or quasi‑fixed) costs.
2. Variable and Operational Costs
These costs change more with volume and usage. The more scans you do, the more significant these are.
Staffing and labor costs
Radiologists, technologists, nursing support, and administrative staff are all essential. Radiologist salaries alone can exceed half of the total operational costs. Ongoing training, credentialing, and turnover management add further expense and can affect productivity-linked Work RVUs.
Consumables and contrast agents
Items like contrast media, disposable supplies, imaging plates, sterile disposables, and protective gear are essential and scale with volume. Because they’re billed per procedure, these costs grow linearly with volume, and influence the variable practice expense portion of reimbursement.
Utilities and energy
Large scanners are energy hogs. Running cooling systems, magnets, vacuum pumps, and other subsystems consumes a lot of energy. Energy costs rise with daily scanner hours and must be factored into PE RVU calculations that reflect operating expenses.
Insurance and liability/malpractice
Radiology carries risks like misreads, complications, and regulatory issues. You’ll need coverage for equipment, property, and professional liability, which should be forecasted annually.
Administrative overhead and compliance
Billing, coding, accreditation, and quality assurance expand as scan volume grows. Efficient workflow systems and automation can lower the administrative cost per scan and preserve margin even under flat reimbursement rates.
3. Indirect and Hidden Costs
Indirect costs often slip through standard budgeting but have a major impact on radiology margins and on how accurately practice expense RVUs reflect real operating conditions.
Downtime and opportunity cost
When a scanner is offline for maintenance or repair, that’s lost revenue. If backup capacity isn’t available, you may have to outsource or refer out, which reduces control and increases cost.
Underutilization and idle capacity
Your fixed assets are only efficient if you keep them busy. Low scan volumes or scheduling inefficiencies increase the per‑scan fixed cost burden.
Obsolescence and upgrade risk
As technology advances, older models become less competitive. Skipping upgrades may save money now, but you may lose throughput, efficiency, or reimbursement opportunities.
Interdepartmental “shared” costs
Items like IT support, facility infrastructure (power, HVAC), centralized admin, HR, and utilities may be allocated from the broader health system to the radiology unit. Understanding these allocations ensures that RVU-based reimbursement models align with actual overhead.
At AAG Health, we help healthcare leaders make sense of these cost structures by using real-world data, industry benchmarks, and consultative insights to drive smarter decisions and stronger margins.
Why Understanding Radiology Costs and RVUs Matters for Hospitals and Clinics
Fixed imaging costs push hospital break-even volumes higher than most specialties. Below that threshold, each underused scanner inflates per-scan cost and erodes margin. Once volumes rise, managing variable expenses, staffing, consumables, and energy becomes critical to maintaining profitability.
Misallocated indirect costs or untracked downtime distort financial reporting and make radiology appear more or less profitable than it really is. These discrepancies also skew practice expense RVUs, affecting how reimbursement aligns with true operating costs.
By understanding each cost category, fixed, variable, and indirect, you can accurately forecast returns, plan capital cycles, and negotiate service contracts. Plus, you can determine which imaging services should remain in-house versus outsourced for better cost-to-RVU alignment.
RVUs: Relative Value Units Explained
When you're trying to break down radiology costs, RVUs are one of the core pillars. They're how Medicare and many private payers translate clinical activity into dollars. If you don’t understand how they work, you’re essentially flying blind when it comes to forecasting revenue or justifying costs.
What Are RVUs: The Building Blocks
Relative Value Units, or RVUs, were designed to standardize how much effort and expense go into delivering different medical services. For every CPT code, Medicare assigns three components:
- The Work RVU, which reflects the physician’s time, intensity, and expertise;
- The Practice Expense RVU, which covers the costs of running the service (like staff, supplies, and equipment);
- The Malpractice RVU, which accounts for liability risk.
These three pieces are added together to get the total RVU for a service. That number is then multiplied by Medicare’s conversion factor, which is a fixed dollar amount updated annually, to calculate reimbursement. It’s a simple formula on the surface:
Reimbursement = (wRVU + peRVU + mRVU) × Conversion Factor
But of course, real-world reimbursement gets more complicated once you add in geography, place of service, and policy changes. We’ll cover those shortly.
Why Radiology’s RVU Composition Is Special (and Risky)
Most specialties rely heavily on Work RVUs since the physician’s time and effort are the bulk of the value.
Radiology flips that equation. Because of its infrastructure-heavy nature, Practice Expense RVUs often make up about 70% of the total RVU for an imaging service, which is far higher than the 45–50% seen in other fields.
This imbalance makes radiology uniquely vulnerable to changes in reimbursement policy. If CMS adjusts how PE RVUs are calculated or applies budget-neutral cuts, radiology departments tend to feel it more acutely than other specialties.
A small tweak to practice expense valuation can translate to a significant drop in reimbursement, even when the work and malpractice components remain untouched.
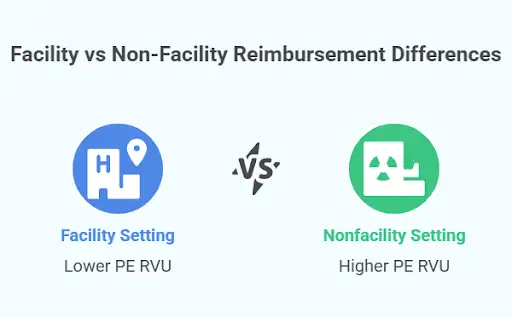
Facility vs Non-facility Reimbursement Differences
The location where a radiology service is performed also plays a significant role in determining the reimbursement amount. If a scan is done in a facility setting, like a hospital outpatient department, the assumption is that the facility itself bears more of the cost. So, Medicare assigns a lower PE RVU to the physician component.
But in a nonfacility setting, like an independent imaging center, the provider is on the hook for more overhead. That means the PE RVU assigned is higher, and reimbursement increases accordingly.
These place-of-service adjustments can significantly change financial outcomes, so practices and systems must understand how location impacts RVU value and plan services accordingly.
Examples
Let’s say you perform a CT scan with contrast. Medicare might assign that procedure a Work RVU of 3.0, a Practice Expense RVU of 9.0, and a Malpractice RVU of 0.5, totaling 12.5 RVUs. If the current conversion factor is $36.00, that scan would bring in $450 in reimbursement before geographic or site adjustments.
But what if CMS decides to recalculate PE costs and drops that component to 8.0? Suddenly, the same scan is worth just $414, a nearly 8% cut, without any change in actual work or risk. For practices operating on slim margins, that kind of change adds up fast.
Why Understanding Radiology RVUs and Reimbursement Matters
For radiology departments, understanding RVU structure is key to navigating margin pressure. The heavy reliance on Practice Expense means radiology is particularly sensitive to changes that other specialties can shrug off.
If you're managing a health system or clinic, this knowledge can help you decide which imaging services to expand or scale back, where to locate new facilities, or how to build compensation models that reflect true revenue potential. It also gives you the data you need to advocate more effectively, whether you're negotiating payer contracts or lobbying for CMS policy adjustments.
GPCI: The Geographic Practice Cost Index
So you've got a handle on RVUs… next up is GPCI, the lever that warps reimbursement depending on where your radiology work happens. In short, two practices doing the same scan might get different reimbursements just because of geography.
What GPCI Is (and Why It Exists)
The Geographic Practice Cost Index (GPCI) is Medicare’s tool to adjust RVUs for local cost differences. It acknowledges that overhead, wages, rent, and malpractice costs vary from New York to Nebraska. In the Physician Fee Schedule formula, each RVU component (work, practice expense, malpractice) is multiplied by its own GPCI.
So the adjusted formula looks like this:
Reimbursement = [ (wRVU × wGPCI) + (peRVU × peGPCI) + (mRVU × mGPCI) ] × Conversion Factor
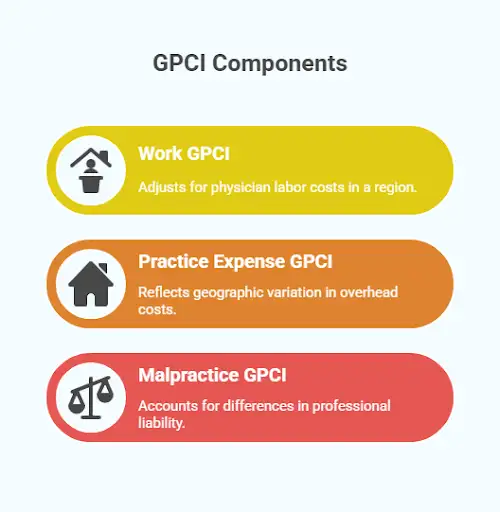
The Three GPCI Components and Their Behavior
Let’s break down what each GPCI piece is targeting:
- Work GPCI (wGPCI): Adjusts for the cost of physician labor in a region (i.e., wages, cost of living)
- Practice Expense GPCI (peGPCI): Reflects geographic variation in overhead: rent, utilities, staff wages, supplies, etc.
- Malpractice GPCI (mGPCI): Accounts for differences in professional liability (insurance premiums, legal risk) across locales
Because radiology leans so heavily on the practice expense side, peGPCI often has an outsized impact on total reimbursement in imaging. A high or low peGPCI can shift margins more than marginal changes in wGPCI or mGPCI.
GPCI Policy Floors and Medicare Adjustments: How They Affect Radiology Reimbursement
GPCI values are shaped by Medicare policy and legislative decisions. Historically, a work GPCI (wGPCI) floor of 1.0 ensured that no region received less than the national average for physician labor, to protect low-cost areas from deep reimbursement cuts.
When Congress or CMS debates removing or modifying that floor, practices in lower-wage regions face immediate downward pressure on payments.
The Government Accountability Office (GAO) has reviewed potential wGPCI and peGPCI adjustments, noting that such changes could significantly shift Medicare payments across localities. Payment localities are carved by region, state, county, or metro, each carrying distinct GPCI values. This means two radiology centers performing identical scans can receive very different reimbursements depending on where they operate.
GPCI Examples: How Regional Differences Change Radiology Payments
Consider this: in 2024, the Medicare schedule included locations where peGPCI exceeded 1.0 significantly.
For example, parts of California have peGPCIs well above 1.0, which reflects the high cost of property and wages. Because radiology is overhead-intensive, that boost can translate into meaningful additional reimbursement for practices in high-cost metro zones.
On the reverse side, rural or lower‐cost areas often have peGPCIs below 1.0, which can compress reimbursements further even for identical clinical activity.
Some recent policy tweaks are also worth noting. For 2024, Medicare maintained a GPCI work floor (i.e., wGPCI no less than 1.0) to stave off steeper cuts in lower‑cost areas. Without that floor, many localities would have dropped below 1.0, which would have meant reduced reimbursement even before other cuts.
How GPCI Insights Help Healthcare Leaders Optimize Radiology Reimbursement
Understanding GPCI dynamics is essential for radiology and hospital decision-makers. Because Practice Expense RVUs carry significant weight in imaging reimbursement, even small GPCI shifts can reshape margins and growth plans.
- Strategic siting matters. If you're planning a new imaging center or expanding services, going into a region with a high peGPCI (or a favorable composite geographic adjustment factor) gives you a buffer.
- You need to monitor updates. GPCI values don’t stay static; CMS periodically updates them (based on new wage data, rent, malpractice premiums, and so on). Missing a GPCI change can mean underbilling or losing ground.
- Advocacy opportunity. If you represent a region where your operational costs are high but GPCI doesn’t properly reflect that, bringing data to CMS or lawmakers can be persuasive (especially if you can show local wage, rent, and input cost data)
- Negotiation leverage. Use GPCI as part of your discussion when dealing with private payers. Show them how your cost base really works in your geography specifically.
- Risk to low-cost regions. Practices in cheaper geographies are more exposed to negative shifts in GPCI (especially if floors or protections are removed). Their margins have less cushion.
Technology and Equipment: A Big Cost Factor
When people think of radiology costs, the big machines usually come to mind, and for good reason. As well as being expensive to buy, these imaging systems carry long-term burdens of upkeep, upgrades, and obsolescence. If you're in hospital or clinic leadership, this section is your must‑read.
The Price Tag Isn’t Just the Sticker
Buying an MRI, CT, PET, or high-end fluoroscopy unit is only the start. You also have to budget for:
- Site preparation and infrastructure. Walls need reinforcement, rooms require magnetic shielding, power delivery must be enhanced, HVAC and cooling systems need to be expanded, and vibration damping may be necessary. These costs often rival or exceed the equipment’s “sticker” cost.
- Shipping, installation, and inspection/calibration. Logistical costs like specialized heavy lifts, clean rooms, vendor validation, and regulatory inspections add up and take time.
- PACS, software, licensing and integration. The hardware is useless without image storage, retrieval, network integration, workstation software, security, upgrade contracts, and vendor licenses. That’s a recurring cost.
- Upgrades, modular add-ons, feature expansions. Keeping up with new capabilities like AI-assisted reconstructions, new coils, and dual-energy capabilities often means paying extra or retrofitting existing units.
So the “cost” of the machine is really the cost of owning and operating it long-term, also known as the total cost of ownership (TOC). When you assess your capital investments, you need to account for not just acquisition, but maintenance, operating expenses, and disposal.
Radiology Equipment Depreciation, Useful Life and Obsolescence
Because these machines are capital assets, depreciation is key. It spreads the cost of the asset over its useful life, which reduces annual profits (for accounting) and aligns cost with usage. In practice:
- The simplest method is straight-line depreciation, where you subtract a salvage (residual) value and divide evenly over the useful life. For example: if a CT costs $500,000 and its expected salvage is $50,000 at the end of 10 years, the annual depreciation expense is (500,000−50,000)/10: so $45,000=$45,000 per year.
- But calculating a machine’s “useful life” is tricky. Technically, a piece of equipment may physically last 10-15 years. But because radiology evolves fast, many radiology departments refresh earlier, after 7-10 years or even less, because of efficiency, image quality, throughput demands, or AI/software demands, which renders older hardware less than optimal.
- Also, tax rules (e.g., MACRS in the U.S.) allow accelerated depreciation (higher expense up front), which helps with cash flow and tax benefit front-loading
The practical implication? You can’t treat a scanner, for instance, as a “set and forget” asset… it’ll become less competitive long before it falls apart. That looming obsolescence must be baked into your planning.
Maintenance, Service Contracts and Reliability
Even top-tier machines break down or require fine-tuning. To maintain uptime, you’ll likely enter into service contracts with the OEM or third parties. As we have mentioned above, these often cost 10–15% of the equipment’s capital cost annually, depending on complexity, modality, vendor, and usage.
Downtime can also mean referral leakage to external providers, reputational risk, and rescheduling costs. In high‑volume practices, unplanned downtime is one of the stealthiest margin killers.
Volume, Utilization, and Throughput
You want to maximize the usage of your capital investment. A high‑cost MRI does most of its “heavy lifting” in peak hours. If utilization is low thanks to factors such as gaps in schedules, inefficient booking, and scanner idle periods, your fixed cost per scan goes way up.
Here are some strategies that help:
- Optimize scheduling to cluster complex scans and minimize idle time.
- Extend operating hours when demand allows, especially evenings and weekends.
- Consolidate modalities to smooth workflow and reduce downtime gaps.
- Cross-train staff to prevent bottlenecks when technologists or readers shift workloads.
The more scans you push through, the more your fixed cost dilutes across each exam.
Emerging Technologies: AI, Teleradiology, Remote Upgrades
New tech can both add cost and opportunity:
- AI-assisted processing and reconstruction can speed scans, reduce contrast doses, or improve image quality, but these often require extra licensing or computational infrastructure. If it lets you reduce scan times or increase throughput, it may pay for itself, but you need to model that carefully.
- Remote servicing and predictive maintenance promise to reduce downtime or proactively identify failures, but often at a premium
- Teleradiology and centralized reading models allow you to use fewer reading stations per physical scanner, share radiologist time across sites, or reduce idle “reader overhead.”
The trick is modeling whether the added cost of advanced tech yields a return via efficiency, volume, or quality that justifies it.
P.S. Need help scaling teleradiology or modeling ROI on new imaging tech? AAG Health connects hospitals with credentialed radiologists and real-time data insights to keep reads consistent, compliant, and cost-efficient.
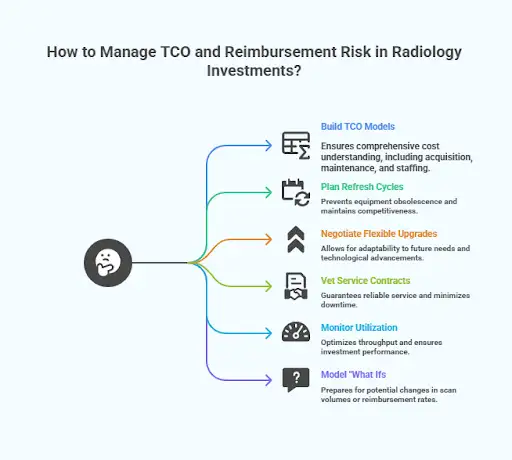
Key Actions for Radiology Leaders: Managing TCO and Reimbursement Risk
- Always build full total cost of ownership (TCO) models for any major imaging investment. These should include acquisition, site prep, software, maintenance, disposal, upgrade, staffing impact, and radiologist time.
- Plan refresh cycles early. Don’t assume the machine you buy today will still be competitive 8+ years out; plan refresh cycles
- Negotiate for flexible upgrade paths or modular features rather than fixed “all-in-one” versions
- Carefully vet service contract terms (response times, parts coverage, uptime guarantees); downtime clauses matter
- Monitor utilization closely. A seemingly “good” scanner purchase can underperform if throughput is weak.
- Model “what ifs”, what happens if scan volumes grow 5 %, or reimbursement cuts of 5 % happen, or an upgrade is needed in year 5?
Radiology Staffing and Workforce Costs
Staffing is one of the biggest and most unpredictable cost drivers in radiology. Machines may be pricey, but people are your recurring expense, your bottleneck, and often your most limited resource.
From radiologists to techs to admin support, your labor strategy shapes your budget just as much as your equipment plan.
Physician Costs: Radiologists and Subspecialists
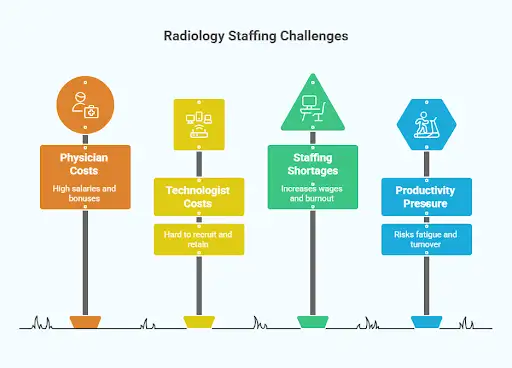
Radiologists aren’t cheap, and they shouldn’t be. In the U.S., average salaries of radiologist are around $498,690 to $584,390 annually as of 2025, and additional bonuses and incentives often push that number even higher. Subspecialists and interventional radiologists can command even more, especially in competitive markets or hard-to-staff locations.
On top of that, many health systems are now moving beyond base salaries to include productivity-based bonuses (like wRVU targets), shift differentials for nights or weekends, and quality-based incentives.
However, even with flexible compensation models, many practices still face recruitment challenges, which is why locum tenens and teleradiology coverage are becoming increasingly common.
While these provide short-term relief, they also raise per-read costs if not managed strategically. AAG Health helps systems balance both models, deploying credentialed radiologists fast while keeping long-term labor costs predictable.
Technologists, Support Staff and Operational Roles
Running a radiology department takes a whole team. Radiologic technologists, nurses, image processors, PACS administrators, schedulers, and coding staff all contribute to the daily flow.
And unlike radiologists, these roles can be even harder to recruit depending on your location, available training programs, or regional pay scales.
Staffing costs across these non-physician roles can easily add up to $300,000-$800,000 per year in a mid-size department, especially when factoring in benefits, shift differentials, continuing education, and certification requirements.
Cross-training your team can help optimize resources, for example, a technologist who is certified in both CT and MRI gives you more scheduling flexibility and helps reduce idle labor time when volumes fluctuate.
Staffing Supply and Shortages
Workforce shortages remain one of the top pressure points in radiology. A 2024 industry survey found that over 55% of radiology leaders cited staffing as their #1 operational challenge, especially for technologists and support staff.
This gap drives up wages, forces departments to rely on agency or contract staff, and increases the risk of burnout among existing employees. It also has downstream financial effects. Scheduling gaps, delayed exams, or rerouted patients due to lack of coverage all add soft costs on top of hard payroll expenses.
Productivity, Compensation Models, and Efficiency
Modern departments tie compensation to productivity metrics like wRVUs per shift or turnaround-time goals. Workflow design now focuses on minimizing handoffs, automating repetitive admin work, and using AI to triage studies.
But balance is essential. Pushing too hard on volume can lead to burnout and turnover, which ultimately reduce throughput and quality.
What Leaders Should Watch and Act On
If you’re building or managing a radiology operation, you can’t afford to treat staffing like a fixed cost.
You’ll need to account for everything:
- Track wRVUs per FTE, average TAT, and idle scanner hours regularly.
- Plan for recruitment, training, and attrition costs in every annual budget.
- Use flexible coverage models, such as hybrid onsite/teleradiology and remote setups, to manage fluctuating volumes.
The reality is that radiology runs on people just as much as it runs on technology. Get the staffing wrong, and the whole system slows down or even grinds to a halt.
That’s where AAG Health comes in. We combine advanced sourcing, data‑driven market intelligence, and an 80% placement success rate to help hospitals and imaging centers secure the right radiology talent faster, more efficiently, and at a lower long‑term cost than traditional staffing models.
Turn Radiology Cost Insights into Action
Radiology's cost structure is heavy; its revenue levers are precise, and the margins, while real, are often thin if everything is not managed tightly. In this article on breaking down radiology costs, we’ve walked through how all the moving parts interact and how every decision from capital to staffing ripples through the bottom line.
Here’s what leaders at hospitals, clinics, and imaging centers should keep in mind:
- Don’t underestimate fixed costs. Scanner acquisition, site prep, maintenance, and software all dominate your baseline burden. Ignoring or under‑forecasting them will bite you.
- Know your RVU structure intimately. Radiology leans heavily on the practice expense component, which makes it more vulnerable to reimbursement tweaks than many other specialties.
- Geography and GPCI matter. Same clinical work in one city may pay more or less, depending on the region’s cost adjustments.
- Payer mix and rates are your buffer. Strong commercial contracts can offset pressure from Medicare or policy shifts. Weak payer mix can swallow margins fast.
- Tech and utilization are levers you can tweak. Efficient scheduling, smart upgrades, and proper investment in AI or workflow tools can help you squeeze more out of your capital.
- Staffing is dynamic, not static. Turnover, shortages, cross‑training, and productivity all need continuous oversight.
- Model, model, model. Scenario planning (5% cut, volume drop, downtime spike) is nonnegotiable. Use metrics, sensitivity analysis, and benchmarking to keep ahead of risk.
As you go forward, the value in breaking down radiology costs doesn’t just lies in being proactive. Use these insights to:
- Make better capital investment decisions
- Negotiate smarter payer contracts
- Advocate with policymakers and adjust to rule changes
- Allocate resources among modalities or locations
- Monitor risk continuously so you aren’t just reacting when damage is done
At the end of the day, understanding radiology costs is about cutting expenses, but more importantly, it’s about unlocking smarter decisions, stronger margins, and better care.
Ready to Rethink Your Radiology Strategy with AAG Health
At AAG Health, we help healthcare leaders solve for the full cost equation. From sourcing high-impact radiologists to helping you model staffing costs against RVU structures and GPCI variables, we bring data, speed, and precision to every search.
Whether you're scaling outpatient imaging, optimizing coverage for CT scanners or Magnetic Resonance Imaging, or simply trying to improve continuity of care without blowing up your budget, we’ve got the tools and track record to help.
Our proprietary sourcing platform generates 400+ daily inquiries, our placements close in under 90 days, and our consultative approach helps you solve key problems.
Contact Us to talk about how we can support your radiology goals with smarter staffing, stronger performance, and sustainable impact.
FAQs
1. Why is medical imaging so expensive?
Medical imaging involves high-end equipment like CT scanners and Magnetic Resonance Imaging (MRI) machines, which cost hundreds of thousands to millions of dollars to purchase and maintain. Add in specialized staff, facility overhead, and software systems, and it’s clear these services aren’t cheap to run.
2. How do insurance providers decide what they’ll pay for imaging?
Insurance providers typically base payments on a blend of Medicare rates, negotiated contracts, and RVU structures. If a scan is done in an urgent care center versus a hospital, rates can vary significantly even for the exact same service.
3. Do costs differ between X-ray services and other scans like MRI or CT?
Absolutely. X-ray services are among the most affordable types of imaging, with lower equipment and staffing costs. In contrast, CT scanners and Magnetic Resonance Imaging systems carry higher costs due to complexity, power consumption, and the expertise required to operate and interpret them.
4. Why do imaging costs vary so much between emergency rooms and clinics?
Emergency rooms often have higher operating costs, including 24/7 staffing and advanced trauma capabilities. That overhead is built into imaging costs. A CT scan in an ER can cost 2–3x more than in a clinic or urgent care facility.
5. How do radiology costs affect patient care?
High imaging costs can delay or deter patients from seeking timely scans, especially if they’re worried about medical bills. But cost efficiency in imaging also means faster access, better patient care, and lower systemic costs when managed right.
6. How does AAG Health help reduce radiology staffing costs?
By combining exclusive search partnerships, proprietary sourcing tech, and real-time compensation data, AAG Health helps clients cut radiology staffing costs by up to 70% compared to traditional contingent or locum-first models, all while boosting continuity of care.
7. What makes AAG Health different from other healthcare staffing firms?
Speed, precision, and partnership. With an 80% success rate on exclusive searches and an average placement time of 55–90 days, AAG Health delivers culturally aligned, retention-ready clinicians backed by data and strategy.
